Sales to Date Analysis
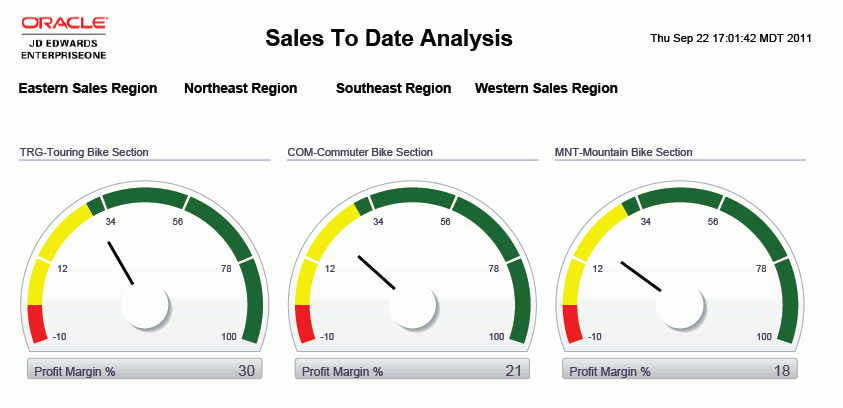
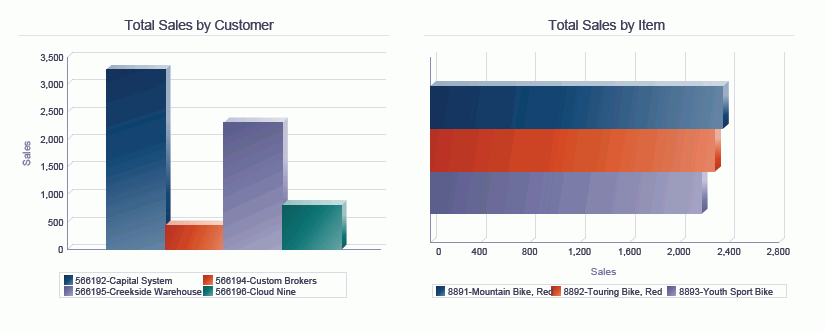
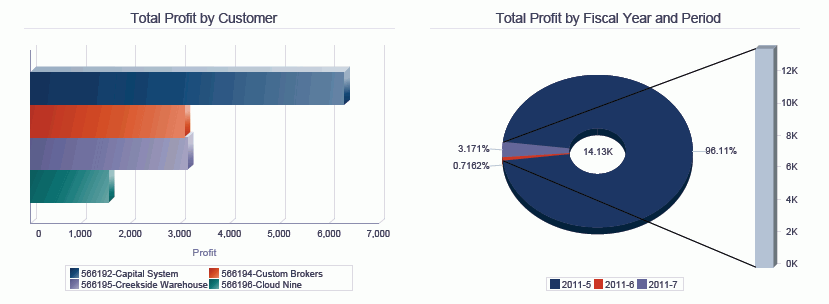
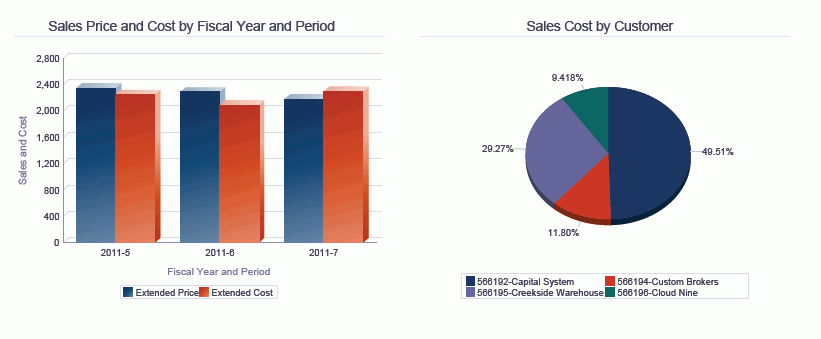
The Sales To Date Analysis enables you to view the open and historical sales orders using region information as a filter. The Profit Margin Percent dial enables you to compare the profit margin on sales orders for the different sub section category codes within the selected region. You could use another category code associated with the item record. The Total Sales by Customer bar chart enables you to view the total sales by customers in the selected region. The Total Sales by Item bar chart enables you to view the total sales for items in the selected region. The Total Profit by Customer bar chart enables you to view the profitability of sales to each customer in the selected region. The Total Profit by Fiscal Year and Period pie chart enables you to compare the sales profit percentage by period. The Sales Price and Cost by Fiscal Year and Period cluster bar chart displays the price and cost for items within each fiscal period. You can compare the profitability of different periods. The Sales Cost by Customer pie chart enables you to view the percentage of sales costs by customer. The Sales to Date Details Table displays both the open and historical sales order detail lines that were included in the selected region.
This report contains the following components:
Profit Margin Percentage by Sub Section (gauges)
Total Sales by Customer (bar graph)
Total Sales by Item (horizontal bar graph)
Total Profit by Customer (horizontal bar graph)
Total Profit by Fiscal Year and Period (donut graph)
Sales Price and Cost by Fiscal year and Period (bar graph)
Sales Cost by Customer (pie chart)
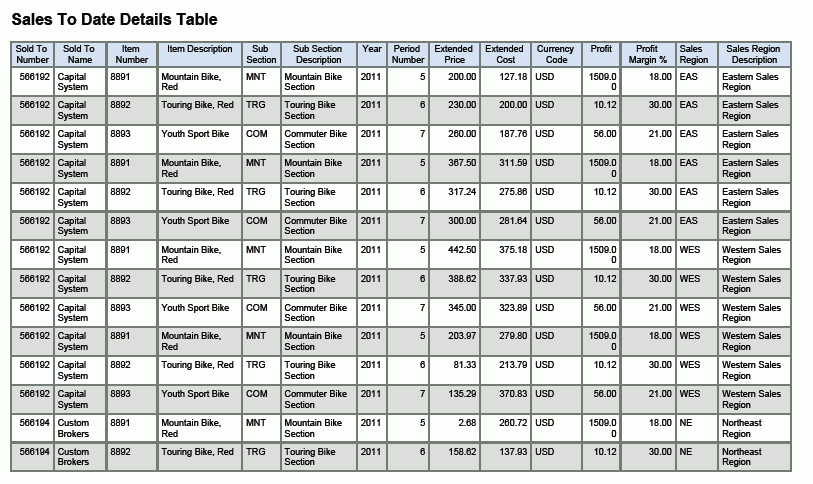
Sales to Date Details Table
The Sales to Date Details table component contains drill back functionality as described in the following table:
Functionality |
Value |
|---|---|
Table column containing drill back link |
Sold To Number |
Table columns passed to application |
Sold To Number, Item Number, Order Number |
Application called |
Sales Order Entry (P42101) |
Form called |
W42101C |
Version called |
ZJDE0001 |