Link Metrics
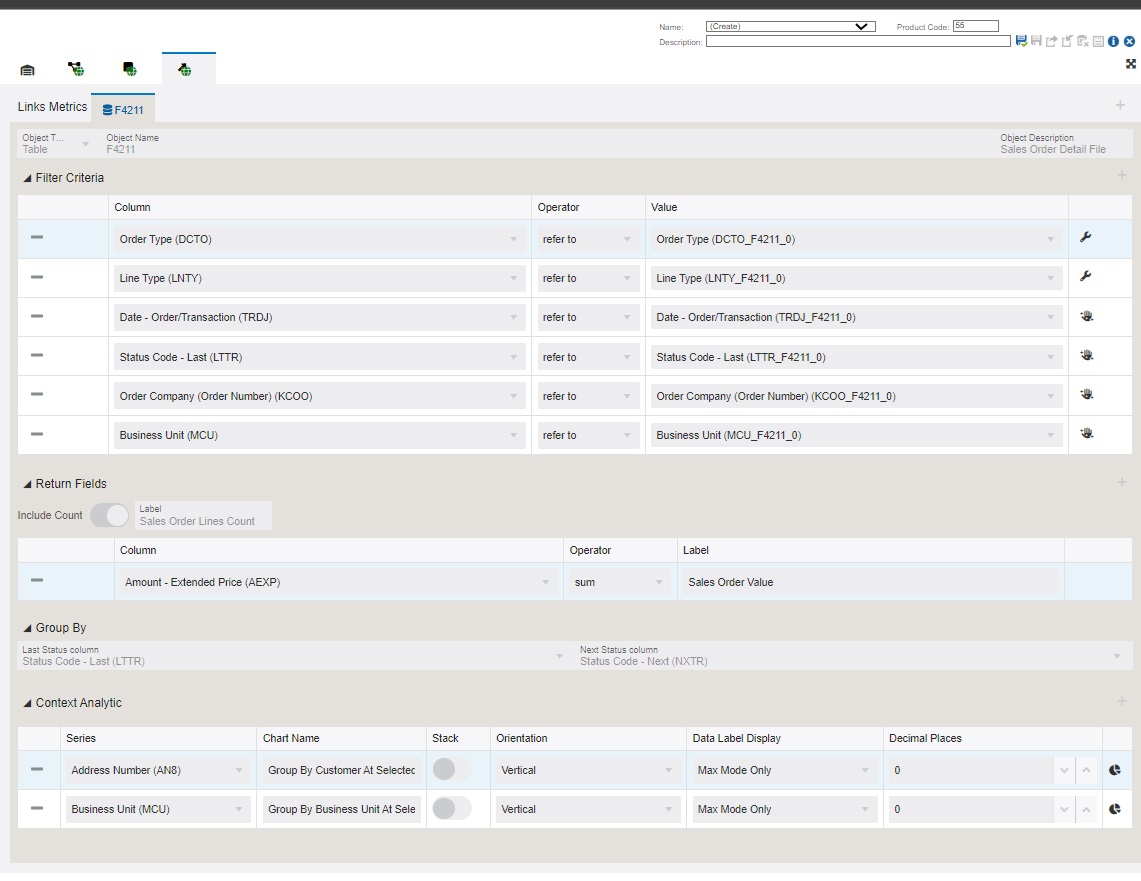
The Link Metrics displays the details such as Filter Criteria, Return Fields, Context Analytics, and so on to analyze or measure a particular link between the nodes.
Click the Links metrics icon to review the settings in the read-only mode.

The F4211 - Sales Order Detail File table is used to fetch the following data.
Object Type: Table
Object Name: F4211
Object Description: Sale Order Detail File table
The Filter Criteria displays the list of columns that are considered for filtering and the value each column is referring to. The system uses the data in Context Analytic section to generate charts. See See "Using the Show Filter Options".
The Return Fields section lists the column that retrun the values. In the Order to Cash process model, Amount - Extended Price is returned as the value.
The data is grouped by Last Status Code and Next Status Code.
Charts
The system uses the data in Context Analytic section to generate charts. For every row in this section, a unique chart is generated.
Based on the details in the Context Analytic section, you can view two charts: Group by Customer at Selected Link for Customer, and Group by Business Unit at Selected Link for Business Unit in the Enterprise Process window.
This table lists and describes the charts that are available on the Link Metrics tab:
Component Title |
Description |
|---|---|
|
Group by Customer at Selected Link |
This pie chart depicts either the Sales Order Value or the Sale Order Lines Count grouped by customer at the selected link depending on the user selected Link Metrics. |
|
Group by Business Unit at Selected Link |
This pie chart depicts either the Sales Order Value or the Sale Order Lines Count grouped by business unit at the selected link depending on the user selected Link Metrics. |