Nodes Metrics
The Nodes Metrics tab displays details such as Filter Criteria, Return Fields, Context Analytics, and so on to analyze or measure a particular node.
Click the Nodes Metrics icon. By default, the Total Count tab is displayed. You can review the settings in the read-only mode.
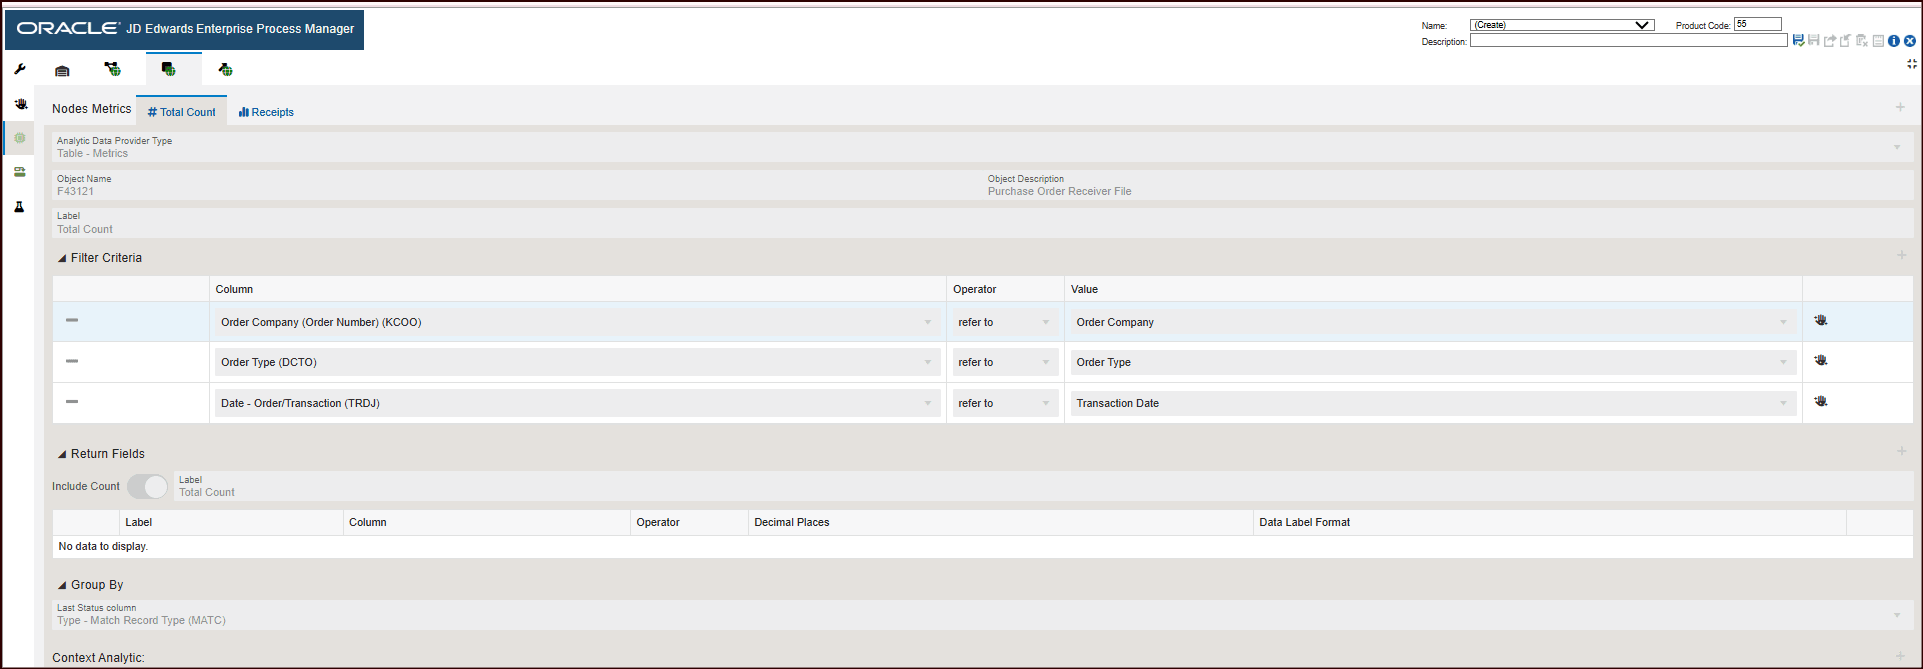
The Node Metrics for Total Count fetches the following:
- Object type: Table -Metrics
- Object Name: F43121
- Object Description: Purchase Order Receiver File
- The Filter Criteria displays the list of columns that are considered for filtering and the value each column is referring to. These filter options are displayed when you click the Show Filter Options icon to analyze the enterprise process. For more information, see "Using the Show Filter Options".
- The Return Fields section lists the columns that return values. In the Receipts process model, the Total Count is returned as value.
- The data is grouped by the Match Record Type.
The Receipts nodes metric includes an additional metric in view mode. Click the Receipts tab.
The tab displays details such as Filter Criteria, Return Fields, Context Analytics, and so on to analyze or measure a particular node.
You can review the settings in the read-only mode.
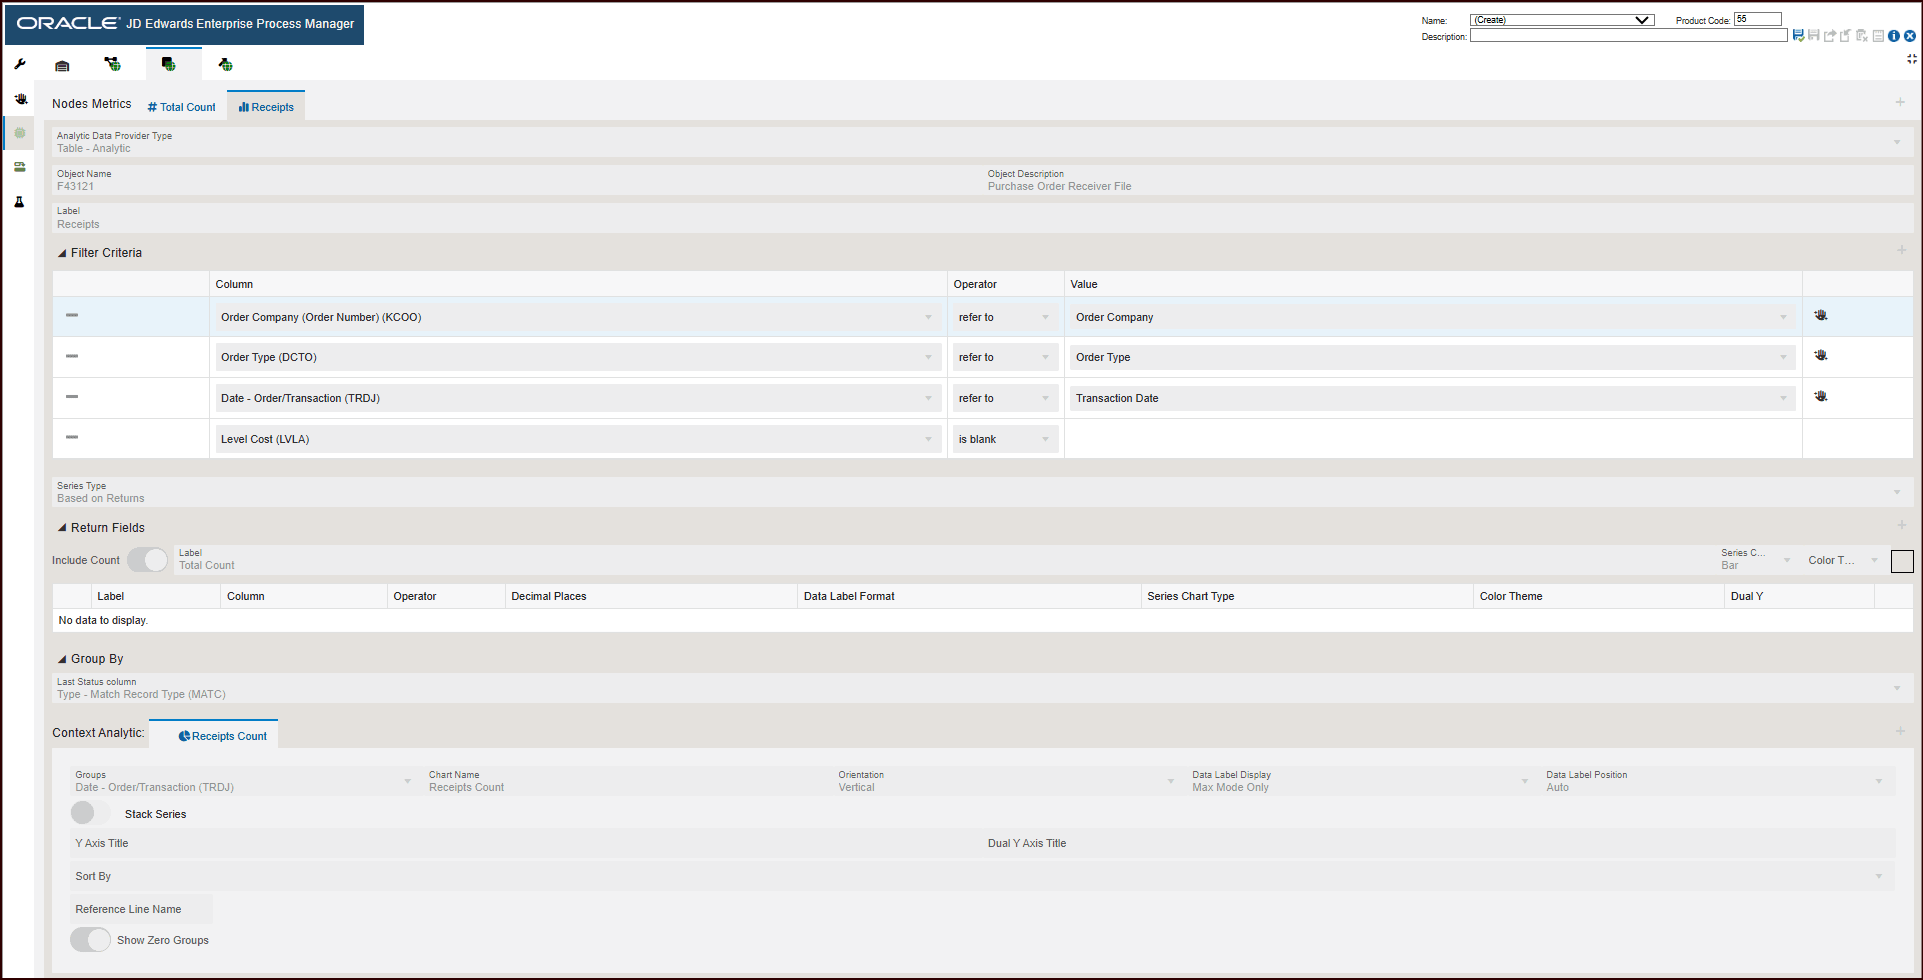
The Node Metrics for Receipts fetches the following data:
- Object type: Table - Analytic
- Object Name: F43121
- Object Description: Purchase Order Receiver File
- The Filter Criteria displays the list of columns that are considered for filtering and the value each column is referring to. These filter options are displayed when you click the Show Filter Options icon to analyze the enterprise process. For more information, see "Using the Show Filter Options".
- The Series Type selected is Based on Returns. This criteria returns standard aggregated values to display the values on charts in preview mode.
- The Return Fields section lists the columns that return values. In the Receipts process model, the Total Count is returned as value.
- The data is grouped by the Match Record Type.
Charts
The system uses the data in Context Analytic section to generate charts. For every row in this section, a unique chart is generated.
Based on the details in the Context Analytic section, you can view the Receipts Count, chart in the Nodes tab of the Enterprise Process Modeler.
This table lists and describes the charts that are available on the Node Metrics tab:
|
Component Title |
Description |
|---|---|
|
Receipts Count |
This chart shows the total count of receipts in the node. The grouping is based on order date and is displayed vertically. |