Node Metrics
Node Metrics tab displays details such as Filter Criteria, Return Fields, Context Analytics, and so on to analyze or measure a particular node.
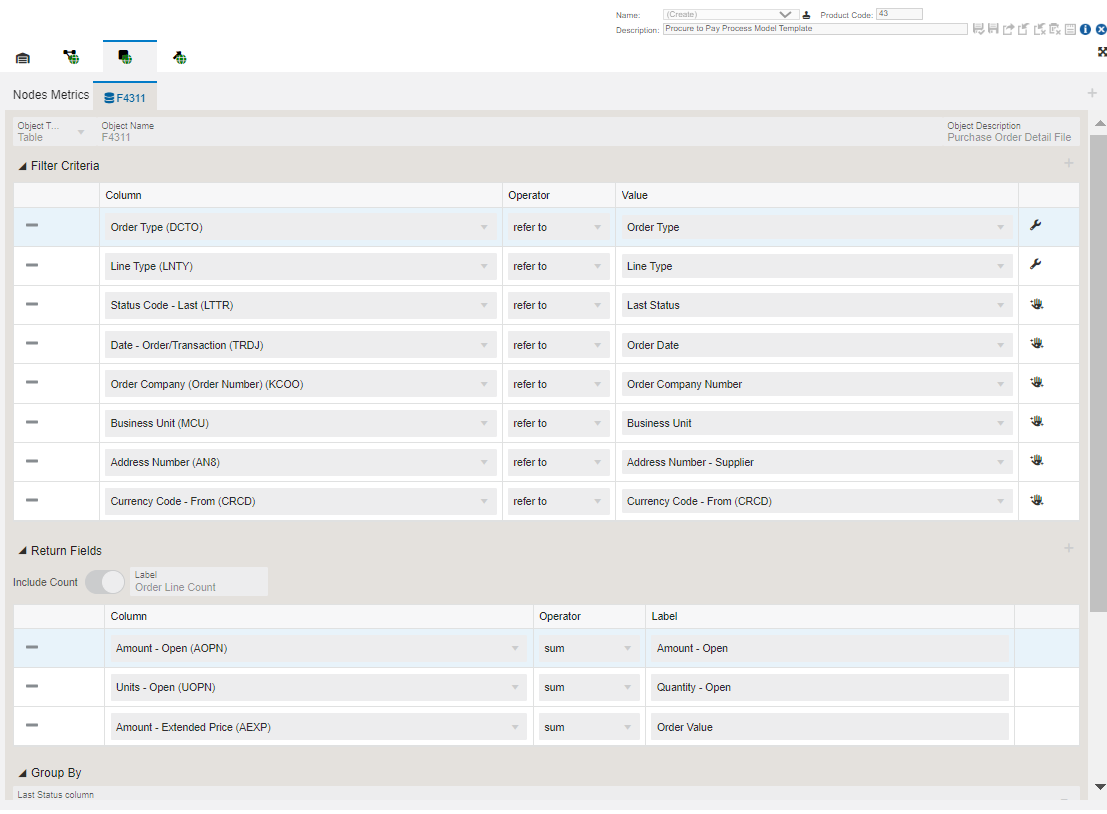
The F4311 – Purchase Order Detail File table is used to fetch the following data.
- Object type: Table
- Object Name: F4311
- Object Description: Purchase Order Detail File table
- The Filter Criteria displays the list of columns that are considered for filtering and the value each column is referring to. These filter options are displayed when you click the Show Filter Options icon to analyze the enterprise process. For more information, See "Using the Show Filter Options".
- The Return Fields section lists the columns that returns value. In the Procure to Pay process model, the sum of Amount - Open, Units - Open and Amount Extended Price are returned as values.
- The data is grouped by the Last Status Code.
Charts
The system uses the data in Context Analytic section to generate charts. For every row in this section, a unique chart is generated.
Based on the details in the Context Analytic section, you can view the Supplier-wise Split at Selected Node, Company-wise Split at Selected Node and Business Unit-wise Split at Selected Node charts in the Enterprise Process Modeler.
This table lists and describes the charts that are available on the Node Metrics tab:
Component Title |
Description |
|---|---|
|
Supplier-wise Split at Selected Node |
This pie chart depicts all the Suppliers and their values at a Selected Node. The grouping is based on Address Number. |
|
Company-wise Split at Selected Node |
This pie chart depicts all the Companies and their values at a Selected Node. The grouping is based on Order Company. |
|
Business Unit-wise Split at Selected Node |
This pie chart depicts all the Business Units and their values at a Selected Node. The grouping is based on Business Unit. |