Process Metrics
The Process Metrics tab displays details such as Filter Criteria, Variables, Series Definition, Context Analytic, and so on for the related tables and business views of the selected enterprise process template. The Process Metrics is used to analyze and measure the overall performance of the process.
Click the Process Metrics icon. You can review the settings in the read-only mode.
For the Approvals process model, the process metrics displays the following information:
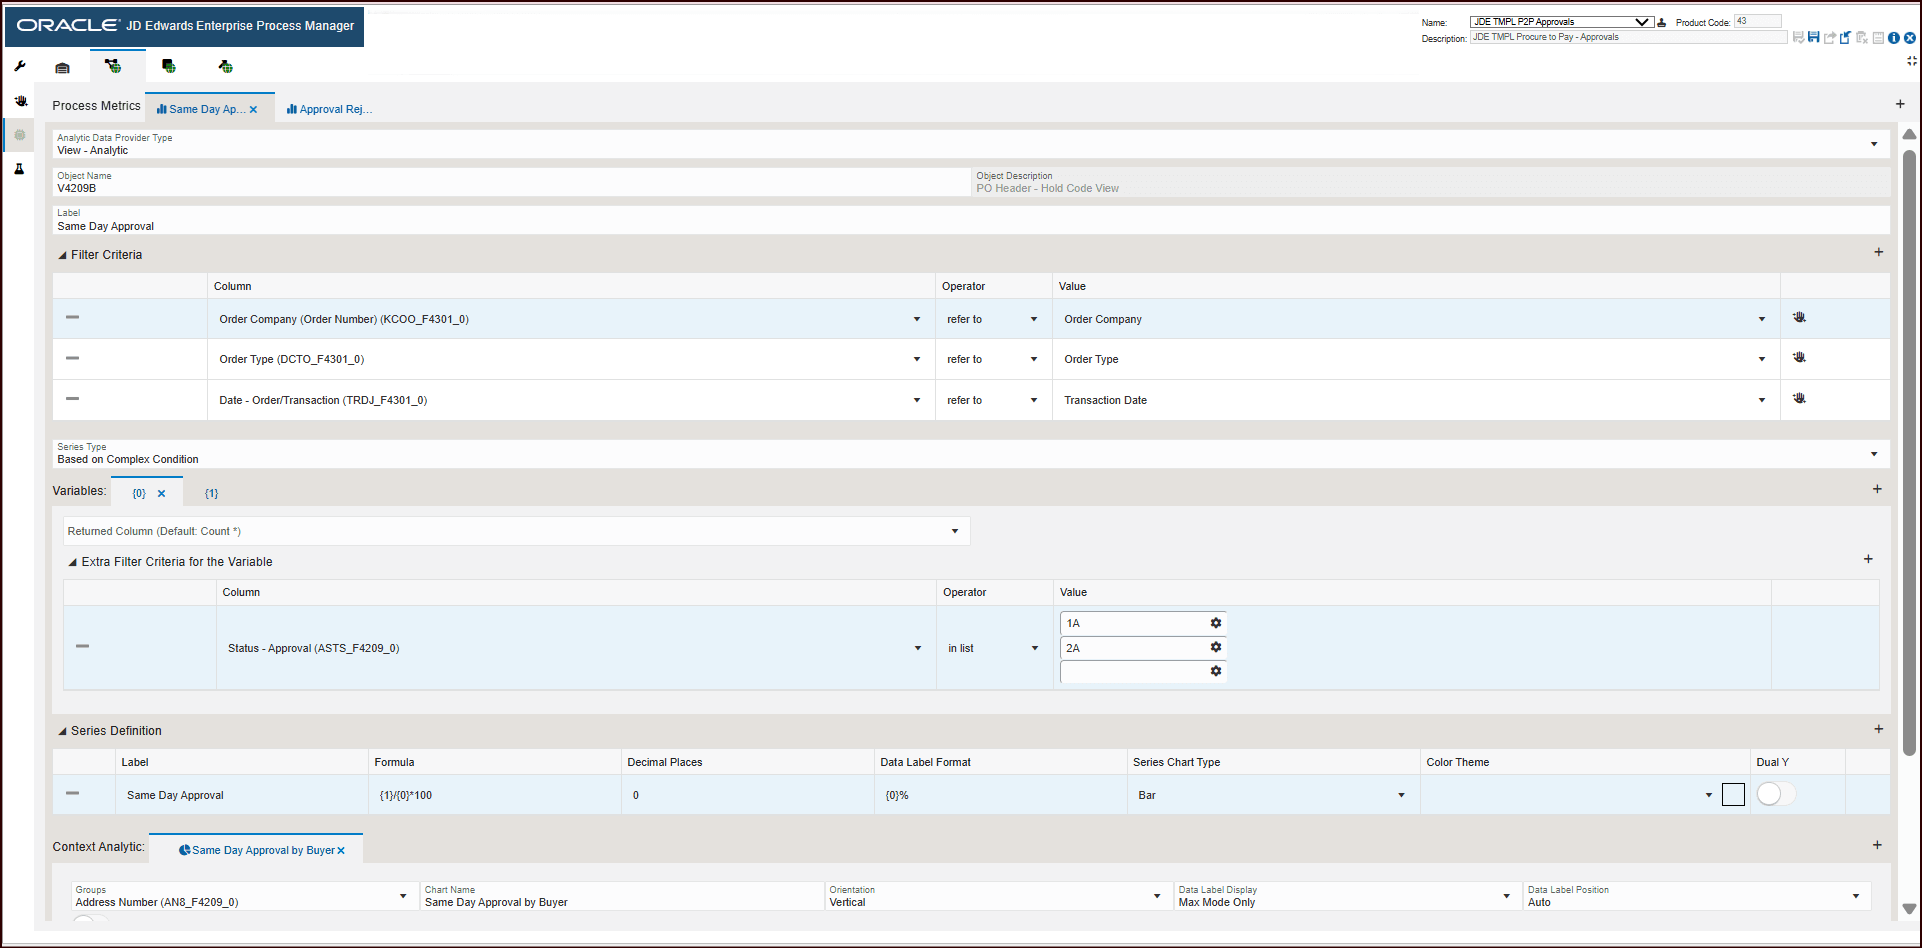
By default, the Same Day Approval tab is displayed.
- Object type: View - Analytic
- Object Name: V4209B
- Object Description: PO Header - Hold Code View
- The Filter Criteria displays the list of columns that are considered for filtering and the value each column is referring to. These filter options are displayed when you click the Show Filter Options icon to analyze the enterprise process. For more information, see "Using the Show Filter Options".
- The Series Type selected is Based on Complex Condition. This criteria returns standard aggregated values to display on the charts in preview mode.
- The Series Definition section defines the formula to calculate the Same
Day Approval.
The system calculates the approval percentage using the formula -{1}/{0}*100 that is, the total number of orders that came for approval divided by the total number of orders approved on the same day, multiplied by 100. The system then returns this value.
- The system uses the data in Context Analytic section to generate charts. For every row in this section, a unique chart is generated.
Charts
Based on the details in the Context Analytic section, the data is grouped by buyer in the Process Metrics tab. In Enterprise Process Modeler, the Same Day Approval by Buyer chart is generated.
This table lists and describes the charts that are available on the Process Metrics tab:
|
Component Title |
Description |
|---|---|
|
Same Day Approval by Buyer |
Use this chart to view the same day approvals by Buyer. The grouping is based on Address Number. The chart depicts the approval percentage for buyers vertically. |
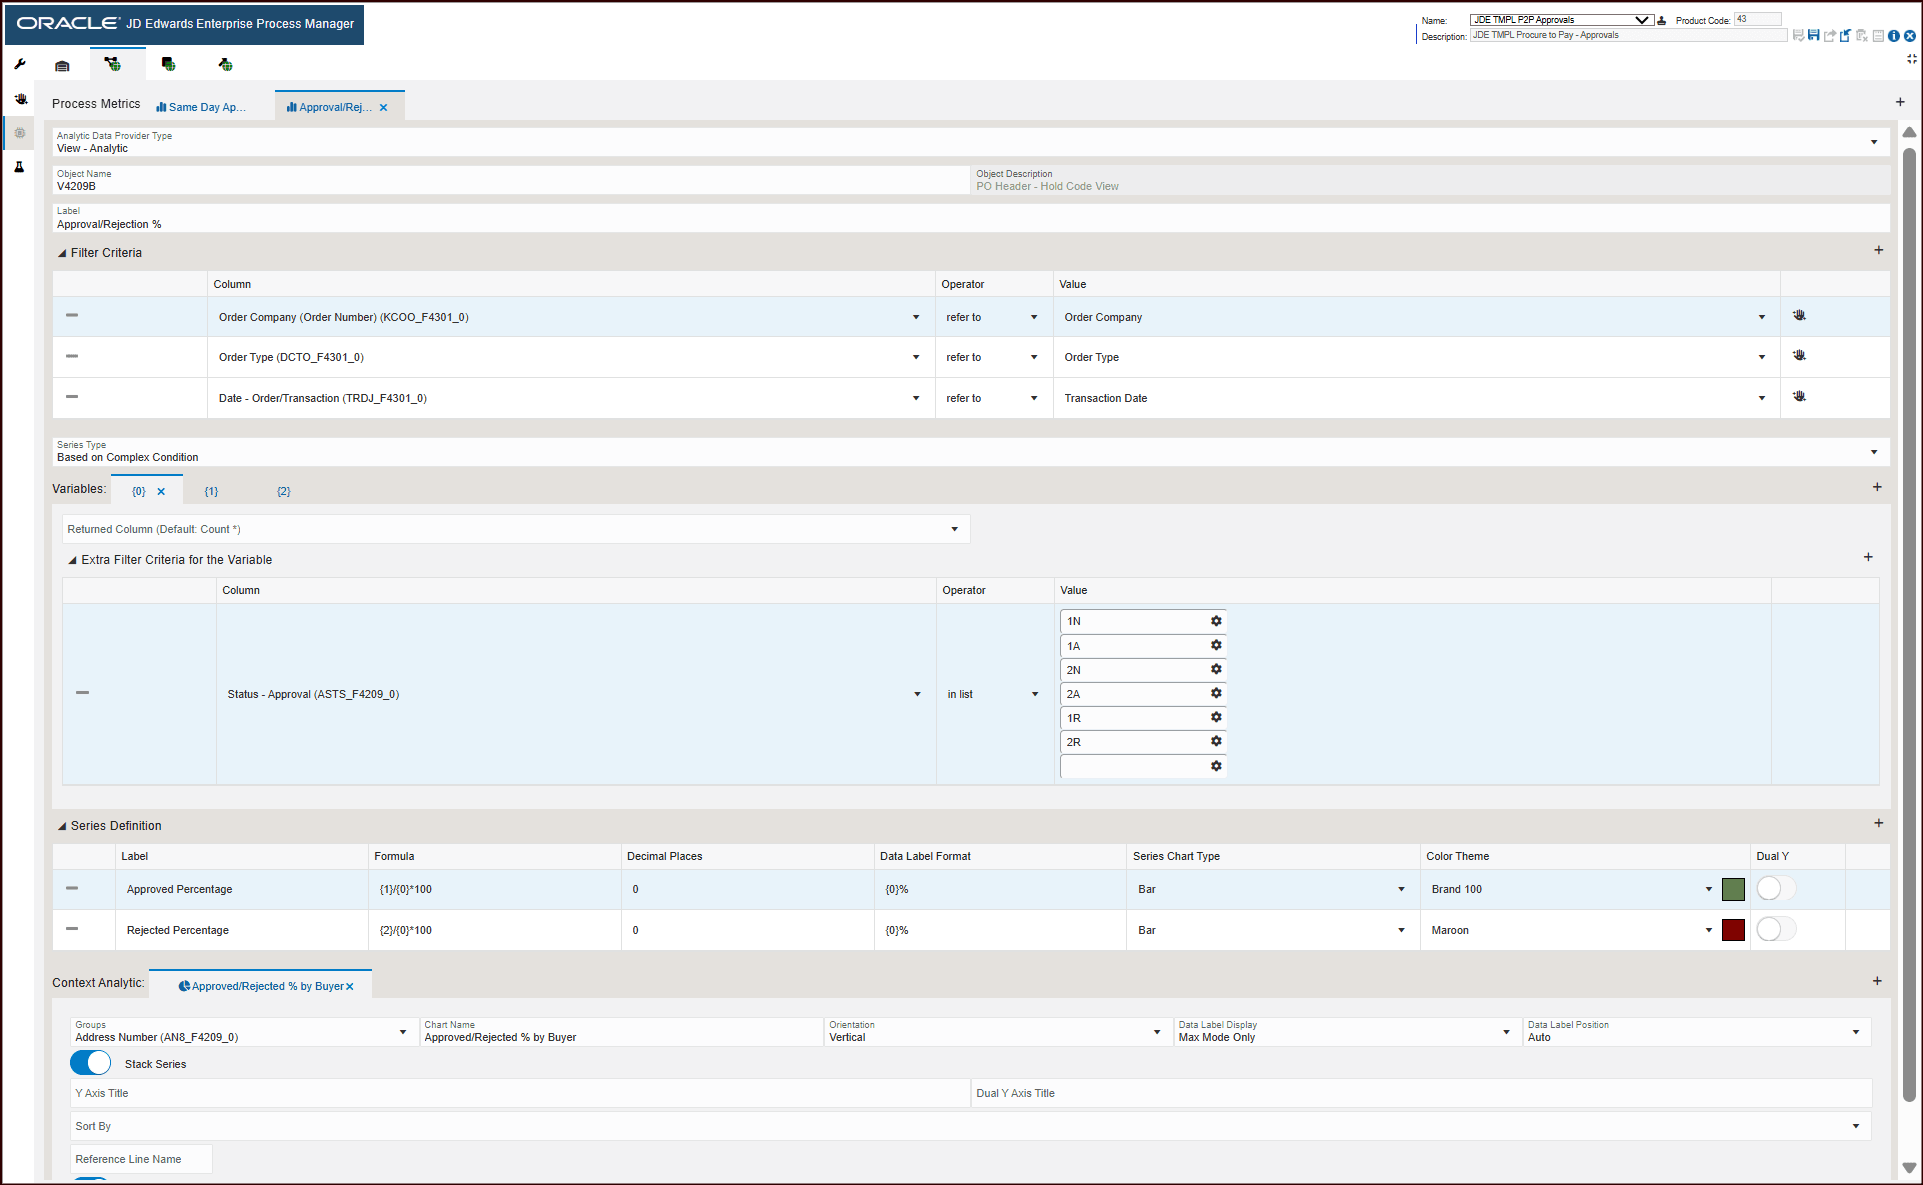
- Object type: View - Analytic
- Object Name: V4209B
- Object Description: PO Header - Hold Code View
- The Filter Criteria displays the list of columns that are considered for
filtering and the value each column is referring to.
In the Status Approval column all the status values are listed in the values column.
- The Series Type selected is Based on Complex Condition. The system performs mathematical calculations based on the variables defined under Variables and uses the formula provided in the Series Definition section and displays these values in the charts.
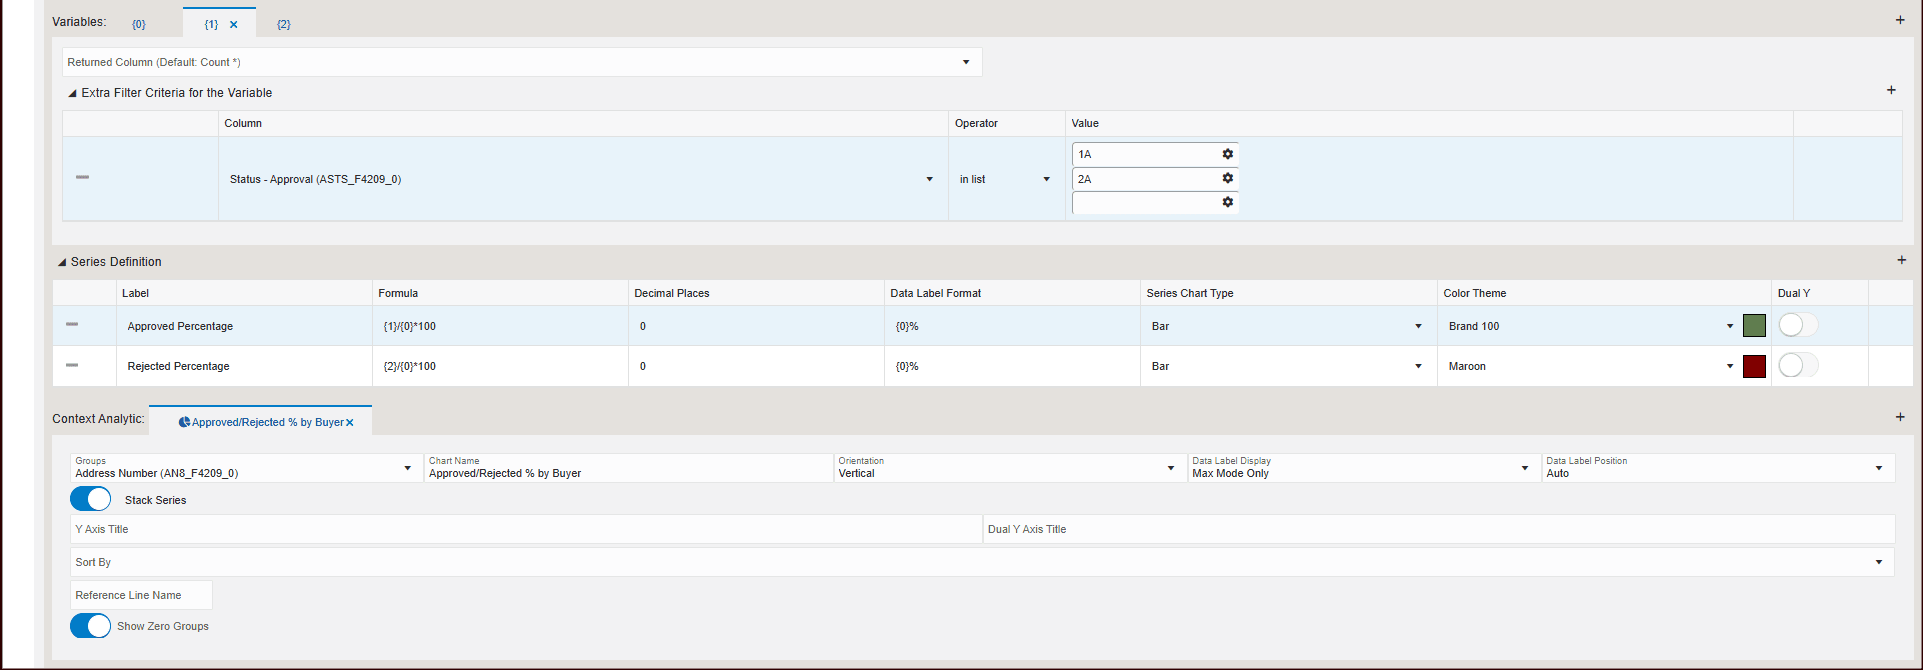
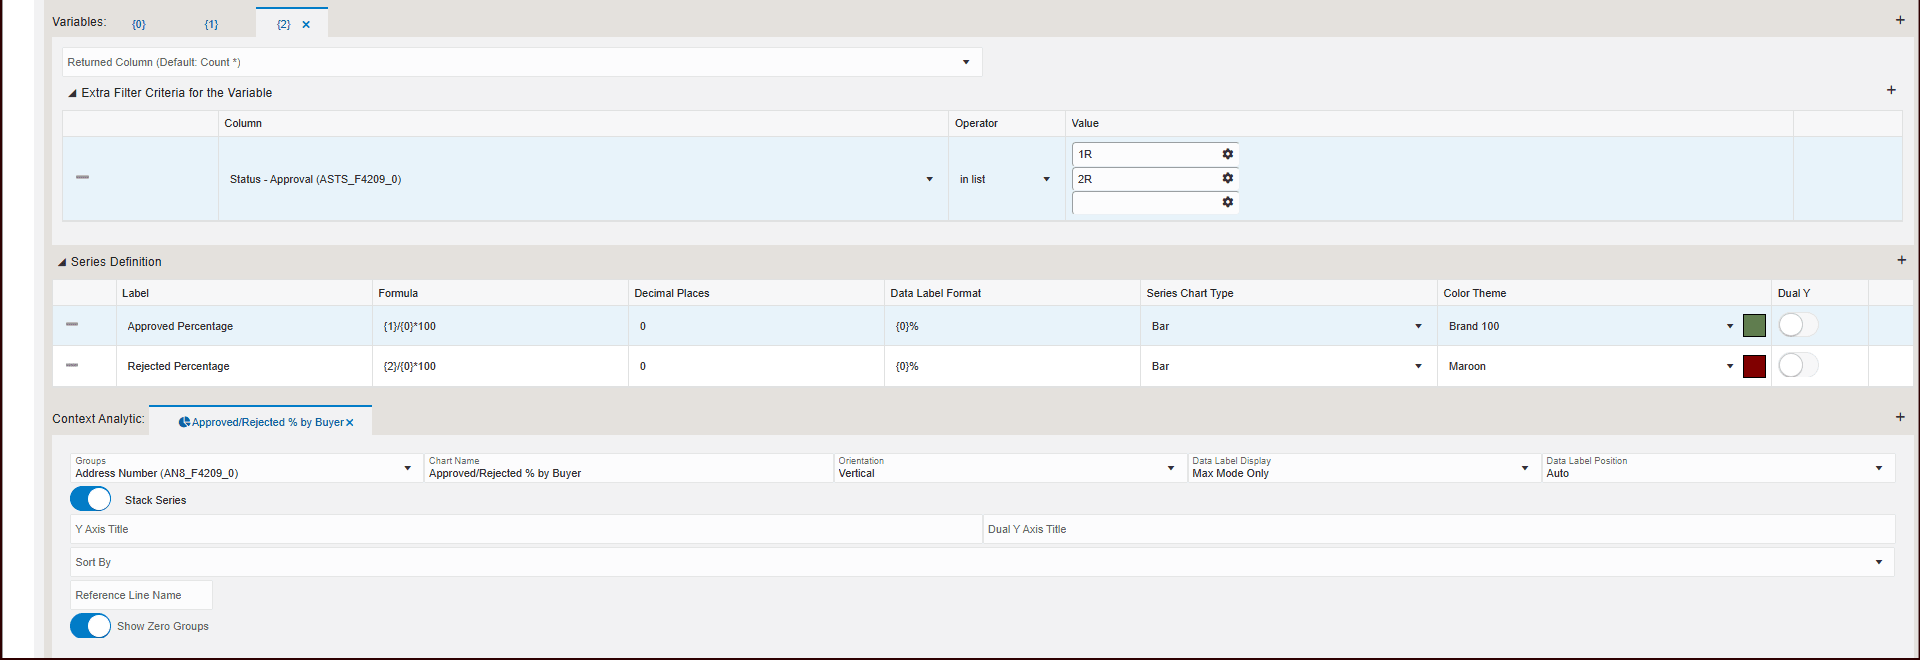
- The Variables section defines each of the Variable ID and the status approval values for them.
- The Series Definition section defines the formula to calculate the
Approval Percentage and Rejection Percentage.
The system calculates the approval percentage using the formula -{1}/{0}*100 that is, the total number of orders that came for approval divided by the total number of orders approved multiplied by 100.
Similarly, the system calculates the rejection percentage using the formula {2}/{0}*100, that is, the total number of orders that came for approval divided by the total number of orders rejected multiplied by 100. - The system uses the data in Context Analytic section to generate charts. For
every row in this section, a unique chart is generated.
Charts
In the Approvals process model, the Approval Rejection % is grouped by Address Number column and is represented in the Approved/Rejected % by Buyer chart. This table lists and describes the charts that are available on the Process Metrics tab:Component Title
Description
Approved/Rejected % by Buyer
Use this chart to view the approval and rejection percentage by buyer. The grouping is based on Address Number.
The chart depicts the approval and rejection percentage for buyers vertically.
The Enterprise Process Modeler displays the number of charts based on the rows defined in the Context Analytics section for Same Day Approval and Approval Rejection % tabs. The Approvals process model displays the Same Day Approval by Buyer, and Approval Rejection % by Buyer charts in the Enterprise Process Modeler view.