Pivoting Data Cubes and Dimensions
Using drag-and-drop functionality, you can easily change the orientation of data cubes and dimensions within an analytic grid to get a different perspective on your data. For example, if your analytic grid initially displays the Month dimension across the columns and the Products data cube down the rows, you could pivot the report to display the Months dimension down the rows and the Products data cube across the columns.
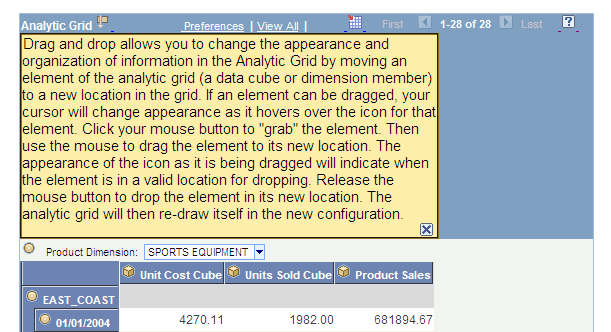
Adjacent to the navigation elements is an icon that provides help text for novice users to perform drag-and-drop operations successfully. Clicking the icon toggles the appearance of the help text.
This example illustrates help text for an analytic grid before completing a pivot operation.
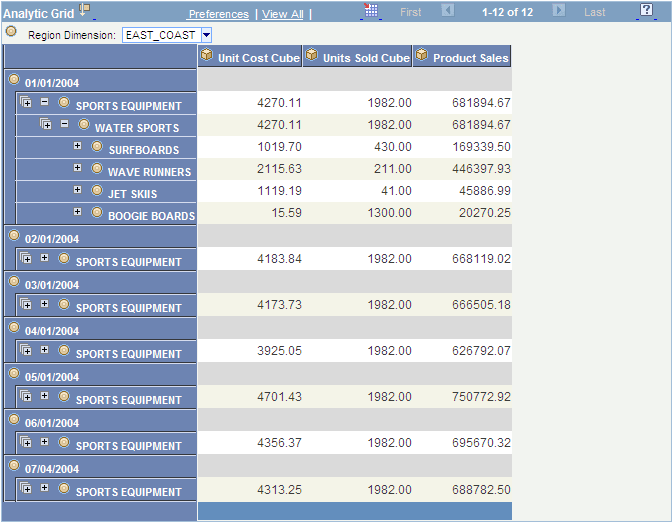
This example illustrates an analytic grid after completing a pivot operation.
To pivot cubes and dimensions within an analytic grid:
-
Move the mouse pointer over the bullet icon representing a dimension or the cube icon representing a data cube.
The mouse pointer turns into a move cursor (a four-headed arrow) with an associated grabber hand.
-
Drag the bullet or cube icon from a column heading to a row heading or vice versa.
As you drag, the grabber hand will turn into an international no sign (circle with a slash) when you are over locations where you cannot drop. You will see a bullet icon (for dimensions) or cube icon (for data cubes) when you drag over locations where you can drop the data cube or dimension.
Note:
You can drop data cubes and dimensions onto the row axis, the column axis, and the slicer bar.