Slicing Analytic Grid Data
Slicing allows you to view a subset of your data. You can slice your data by choosing from any list—representing data cubes or dimensions—that appears on the slice bar by default. In addition, you can add data cubes or dimensions to the slice bar and use them to view alternate slices of your data. You can place multiple data cubes or dimensions on the slice bar. You can also slice your data further (viewing subsets of subsets) by choosing members from various data cubes and dimensions upon which to slice.
Note:
You can add as many data cubes or dimensions to the slice bar as you want. Three fit per row, so if you add more than three, the fourth and so on are added to a second row on the slice bar. However, note that you can place only a single data cube on the slice bar. When you do so, the analytic grid reflects the data for that data cube only.
This example illustrates a slice that shows only February data.
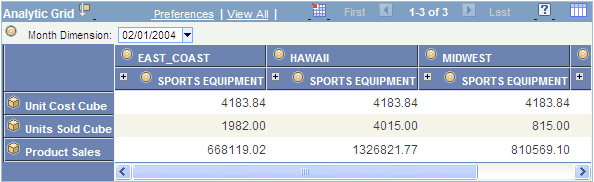
To slice your data based on a data cube or dimension that already appears on the slice bar:
-
Use the list box on the slice bar to display the values for the relevant data cube or dimension.
For example, a Months dimension would contain a list of months.
-
Select the desired value from the list box.
The analytic grid changes to show only data related to that value. For instance, if you select the month of March, you will see only data for that particular month.
To add a data cube or dimension to the slice bar and use it to slice your data:
-
Drag the desired data cube or dimension to the slice bar.
-
Select a member.
You will now see data related to that member only.
Dimensions that have filter functions applied will behave differently depending on whether they reside on the column axis, row axis, or slice bar.