Working with Hierarchical Dimension Data
Some dimension data has a hierarchical structure. When this is the case, you can expand and collapse dimension data within the analytic grid. In addition, you can drill down into the hierarchy to get a closer look at a particular subset of the data.
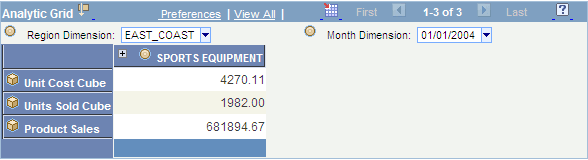
This example shows a collapsed analytic grid with multiple nodes to expand.

This example shows a collapsed analytic grid.
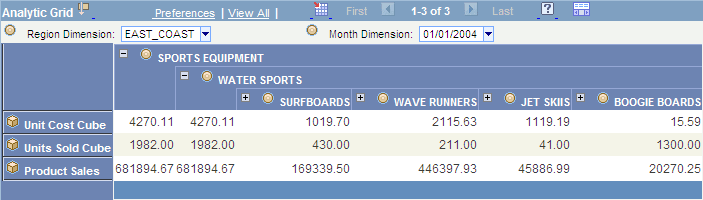
This example shows an expanded analytic grid.
To expand or collapse dimension data:
-
Click the plus sign to the left of the dimension name to expand that dimension, showing all subdimensions immediately beneath it.
This approach expands the dimension one level at a time. If you click the multiple plus sign to the left of the single one, then all the dimensions are expanded.
-
Click the plus sign to the left of any subdimensions to expand them.
-
Click the minus sign to the left of any dimension to collapse it.
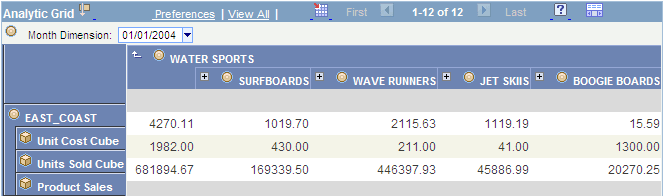
This example illustrates drilling in to see just the water sports information.
To drill into and out of dimension data:
-
Click any dimension or subdimension that has elements beneath it in the hierarchy (it is underlined and has a plus or minus sign to its left).
The plus or minus sign changes to a Drill out this node arrow, and you see only the dimension or subdimension you clicked plus any elements directly beneath it in the hierarchy.
-
Click the Drill out this node arrow to drill back out within the hierarchy.
The dimension now shows the node that you clicked plus one level above it.