Monitoring a Configuration
Use the Configuration Monitor page to review the status of the configuration template and to review the details.
Access the Configuration Monitor page using the following navigation path:
This example illustrates the fields and controls on the Configuration Monitor page. You can find definitions for the fields and controls later on this page.
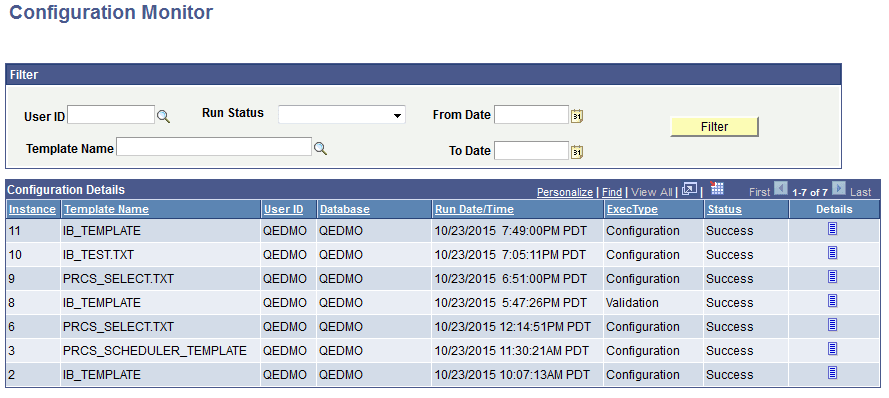
| Field or Control | Description |
|---|---|
|
User ID |
Select a user ID by which you want to filter the search results. |
|
Run Status |
Select either Error or Success to filter the search results. |
|
Template Name |
Select a template name by which you want to filter the search results. |
|
From Date |
Enter a date range by which you want to filter the search results. |
|
To Date |
Enter a date range by which you want to filter the search results. |
|
Filter |
Click the Filter button to show results based on the filter criteria. |
|
Details |
Click the Details icon to view the configuration details. |
|
Instance |
Indicates the sequence in which the request was run. |
|
Template Name |
Identifies the template definition name that was the subject of the request. |
|
User ID |
User ID used to run the request. |
|
Database |
Database on which the request was applied or run. |
|
Run Date/Time |
Indicates the date and time the process ran. |
|
ExecType |
Indicates the type of process initiated: Configuration (clicking Execute for example) or Validation (clicking Functional Validation for example). |
|
Status |
Indicates the outcome of the process: Success or Error. |
|
Details |
Click to view the Configuration Details page, which displays information for the selected process run. |