Filters and Visualizations to Review Customized Objects
The summary tiles and visualizations provide object-level context, including customization level, customized object count, usage status, and test coverage.
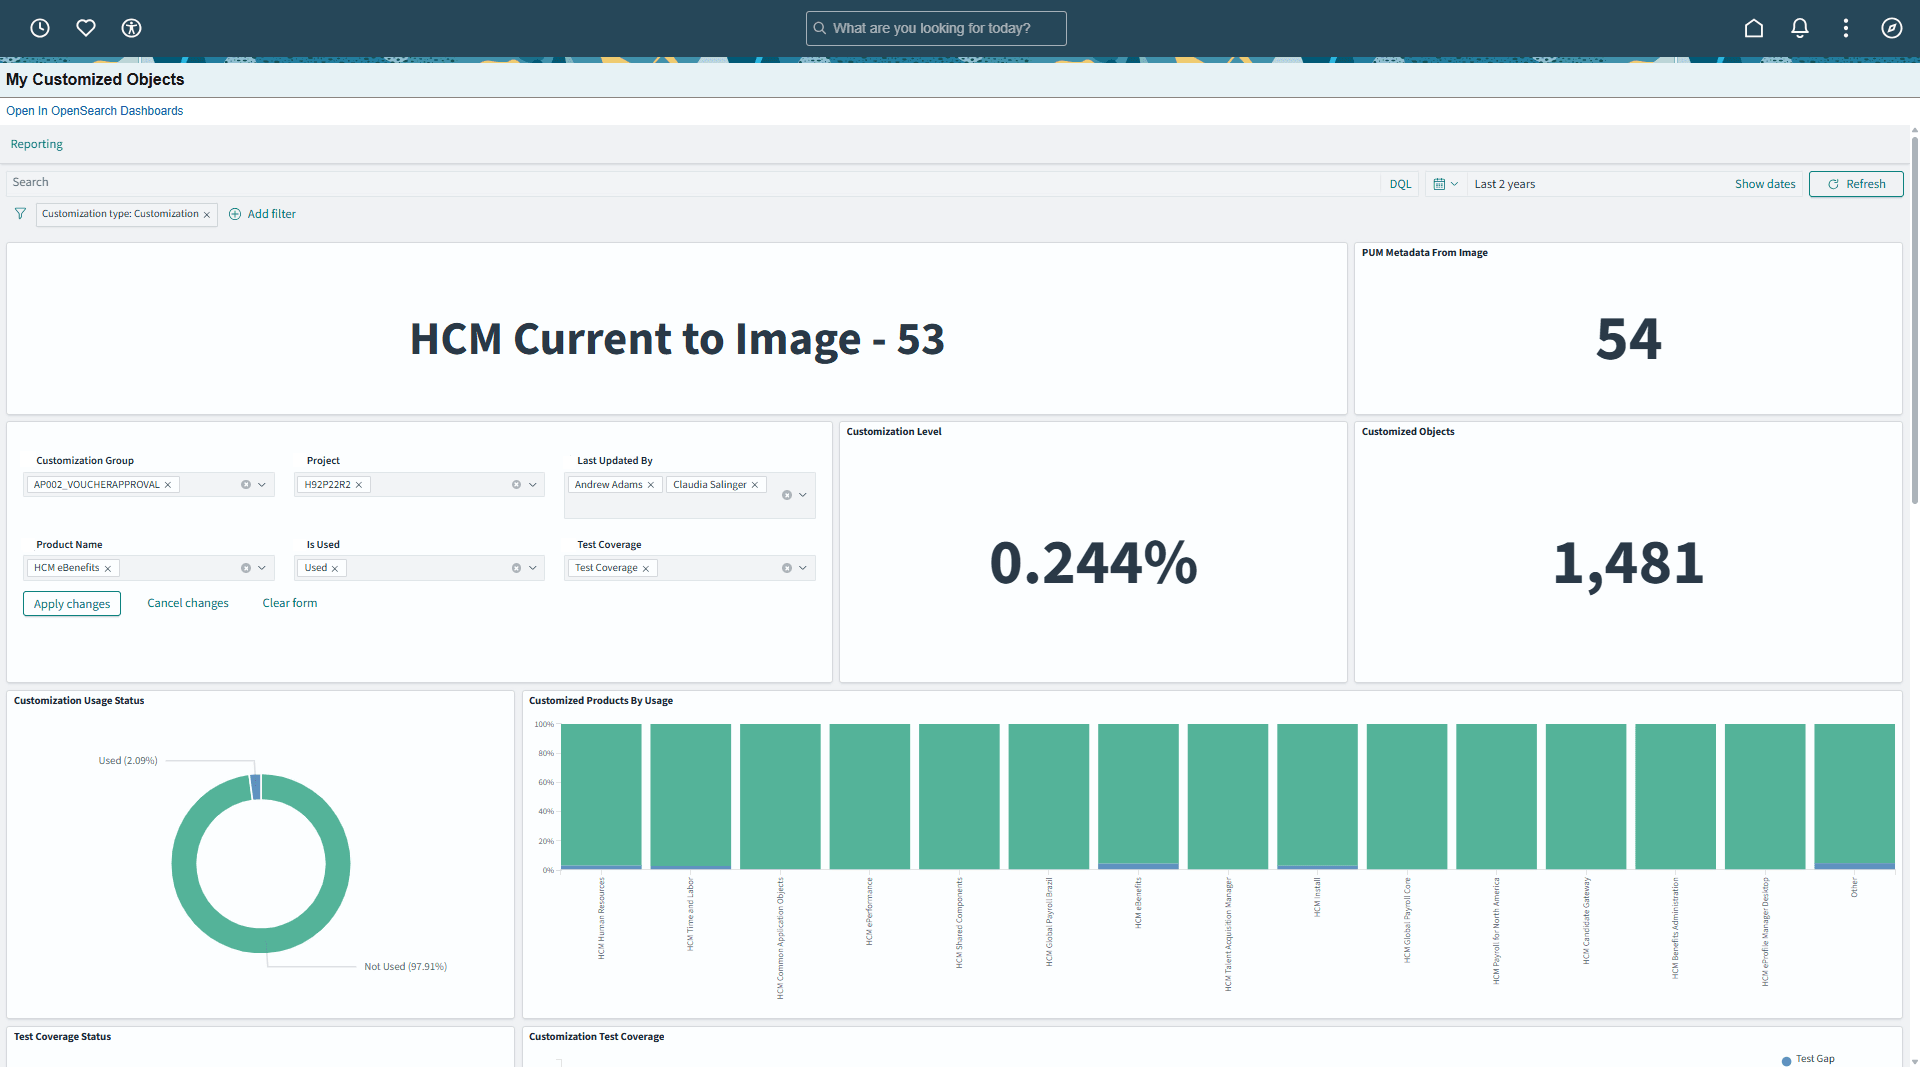
This example illustrates the fields and controls on the My Customized Objects page.
| Summary Information Tile | Description |
|---|---|
|
Environment information tile |
Displays the selected environment and Image level. For example, HCM Current to Image - 53. |
|
PUM Metadata From Image |
Displays the PeopleSoft Update Image that supplied the PUM metadata used by the dashboard. In the example, the PUM metadata is from Image 54. PUM metadata is used by LCM Insights to determine how delivered maintenance impacts customizations. |
|
Customization Level |
Displays the calculated customization level for the current object-level result set and selected filters. On this page, the value provides context for the customized objects being reviewed. |
|
Customized Objects |
Displays the number of customized managed objects included in the current dashboard result set. A customized object is a PeopleSoft-delivered object that has been modified by the customer. This value changes based on the filters applied on the page, such as Customization Group, Project, Product Name, Last Updated By, Is Used, and Test Coverage. Use this value to understand the size of the object-level customization scope that you are currently reviewing. In this example, the value is 1,481. |
Use these options to filter the Insights:
- Customization Group- Select a Customization Group to limit the page results to objects that belong to that group. Use this filter when reviewing or managing objects associated with a specific group.
- Project- Select a project to limit results to customized objects associated with that project. This filter is useful when reviewing project-based customization impact or MO Project-related data.
- Last Updated By- Select one or more users to display objects last updated by those users.
- Product Name- Select a product to display customized objects associated with that product. Use this filter to review product-specific customization impact.
- Is Used- Select a usage status, such as Used, to limit results based on whether the customized objects are referenced in Usage Repository data. The other value is Not Used
- Test Coverage- Select a test coverage value to limit results based on whether customized objects have related test coverage. Use this filter to identify objects that are covered by tests or objects that may require additional testing. The values are: No Value, Test Coverage, Test Gap, and Test But Not Used.
Customization Usage Status
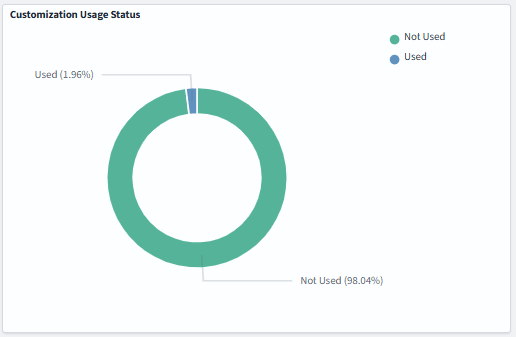
Customization Usage Status displays the percentage of customized objects that are used and not used based on Usage Repository data. Use this to identify how many customized objects in the current result set are actively referenced. Objects that are not used may require additional review before upgrade, maintenance, or cleanup decisions are made.
This example illustrates the fields and controls on the Customization Usage Status.
Note:
The percentages shown in this chart depend on the filters applied to the dashboard and the usage metadata loaded into Lifecycle Management Insights. If usage data has not been loaded or usage calculation has not been run, the chart may not reflect current usage activity. Usage data is processed through the Usage Repository and can be loaded from a production or alternate environment.Customized Products By Usage
Customized Products By Usage compares usage status across customized PeopleSoft products.
This example illustrates the fields and controls on the Customized Products By Usage page.
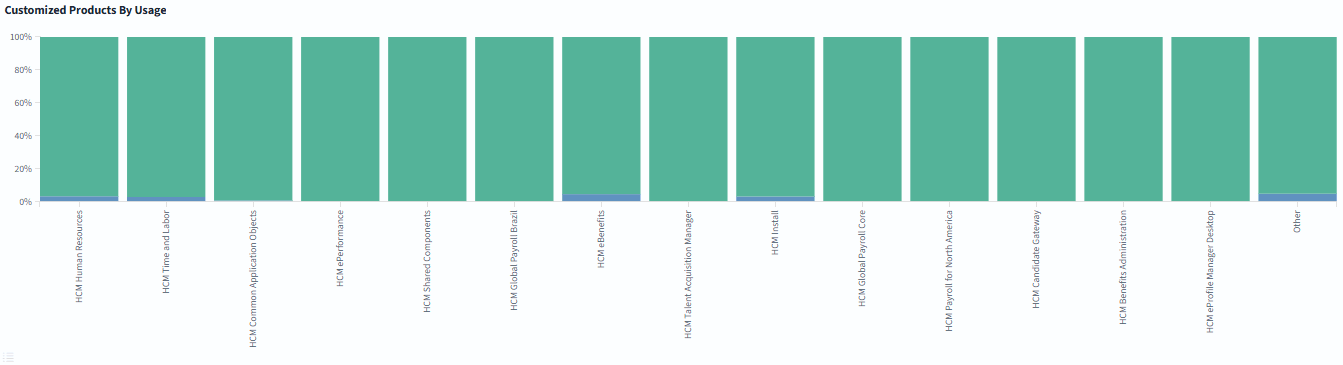
X -axis lists PeopleSoft products such as HCM Human Resources, HCM Time and Labor,
Y-axis displays usage distribution from 0% to 100%.
The available segments are:
-
Green- indicates customized objects that do not have usage data.
The value displayed is Not Used; which represents objects that are not identified as used in the Usage Repository data for the selected dashboard context.
-
Blue- Indicates customized objects that have usage data.
The value displayed is Used, which represents objects identified as used based on Usage Repository data and usage calculation.
Test Coverage Status
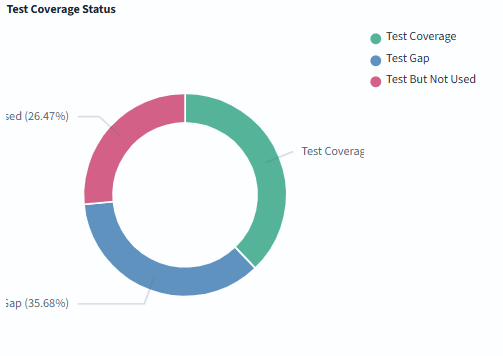
Use the Test Coverage Status to review the test coverage status of customizations for the selected Customization Groups. This visualization compares customizations that are covered by tests, customizations that have no associated tests, and customizations that have associated tests but are not currently used in the Production environment.
This example illustrates the fields and controls on the Test Coverage Status.
The available segments are:
-
Test Gap- indicates the percentage of customizations that do not have associated tests. In this example, this is shown as the blue segment and represents 35.68%. Use this segment to identify customizations that may need additional test coverage.
-
Test Coverage- indicates the percentage of customizations that are actively covered by tests.
-
Test But Not Used- indicates the percentage of customizations that have associated tests but are not currently used in Production. Use this segment to review tests that may no longer be required, or to verify whether the related customization is still needed.
Customization Test Coverage
Use Customization Test Coverage to review the percentage of customizations that have test coverage and the percentage of customizations that have a test gap. Use this information to identify areas where additional test coverage may be required before applying maintenance or reviewing upgrade impact.
This example illustrates the fields and controls on the Customization Test Coverage.
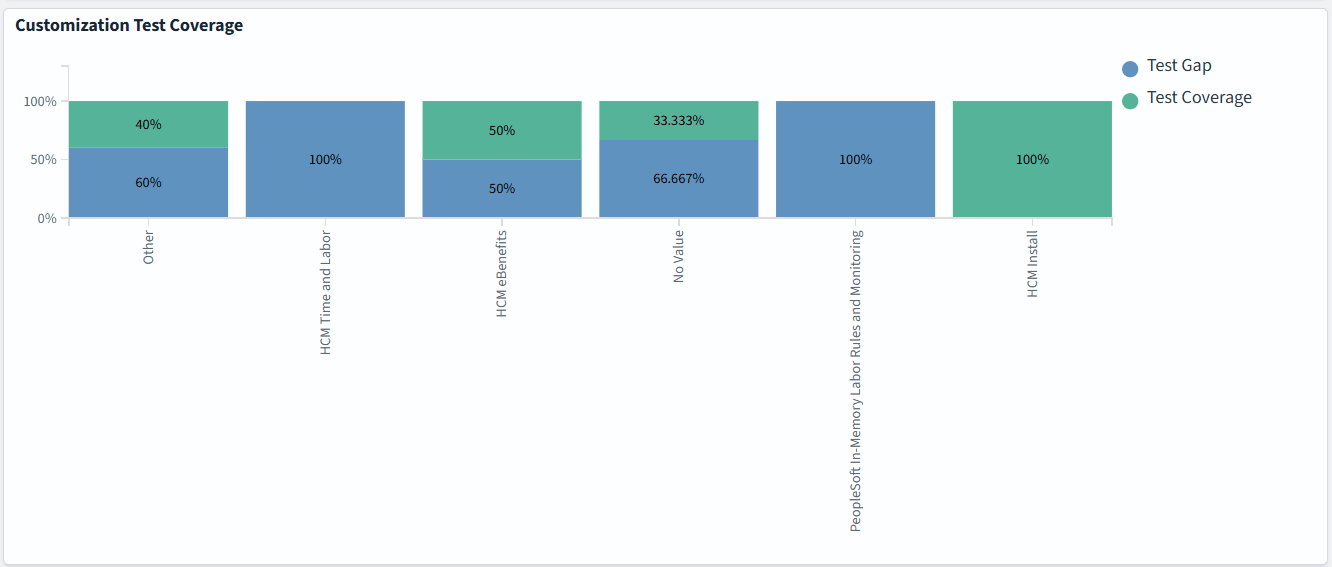
The available segments are:
-
Test Gap- Indicates the percentage of customizations that do not have associated test coverage. In this example, this value is shown in blue.
-
Test Coverage- Indicates the percentage of customizations that have associated test coverage. In this example, this value is shown in green.
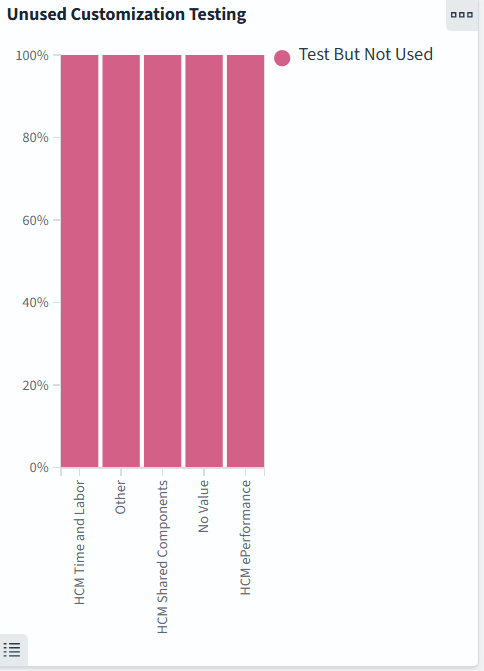
Unused Customization Testing
Unused Customization Testing helps you identify products that have test cases associated with customizations that are no longer used in the production environment.
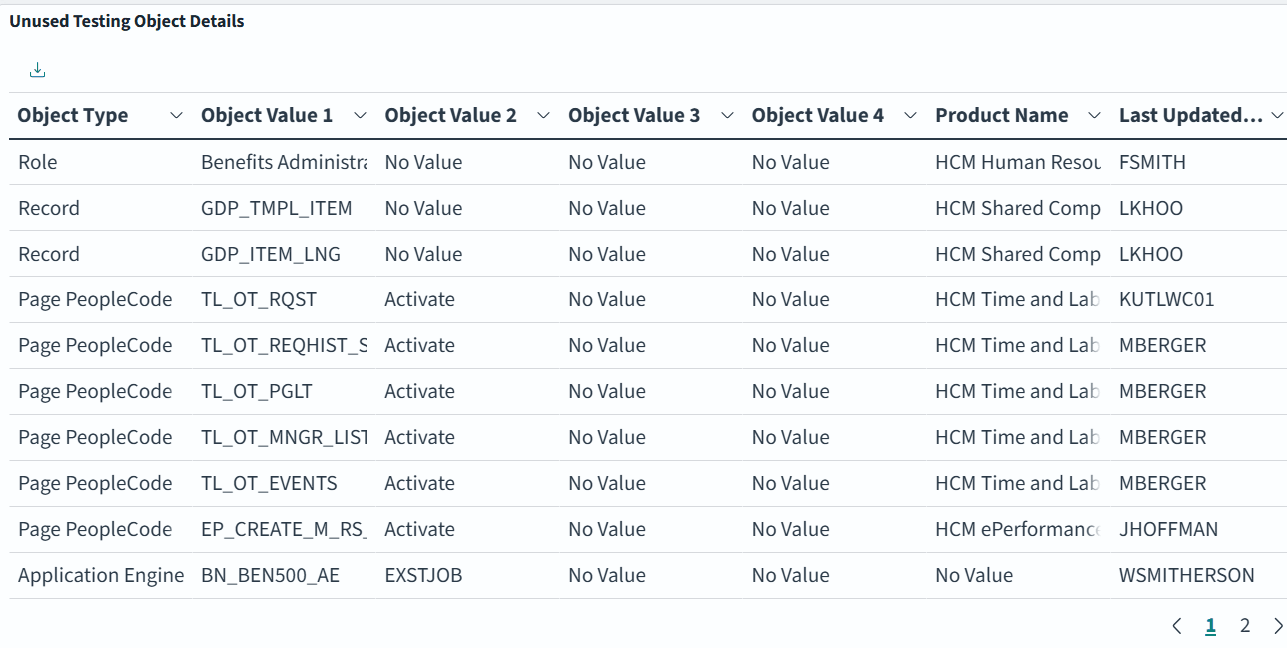
Unused Testing Object Details
Use Unused Testing Object Details to review customized objects that have associated tests but are not currently used.
This detailed view helps administrators identify test assets that may no longer apply to active customizations and determine whether the tests should be retained, updated, or removed.
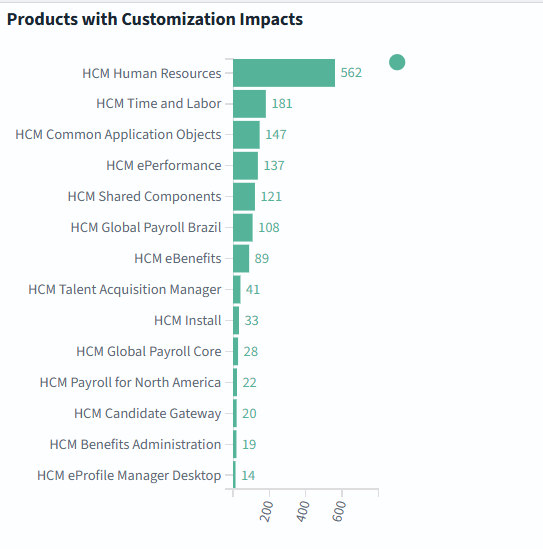
Products with Customization Impacts
Use Products with Customization Impacts to review the number of customization impacts by product.
This helps you identify the products with the highest number of impacted customizations so that you can prioritize analysis and retrofit planning.
Recustomization Efforts
Use Recustomization Efforts to identify products that have recustomization effort across PeopleSoft Images.
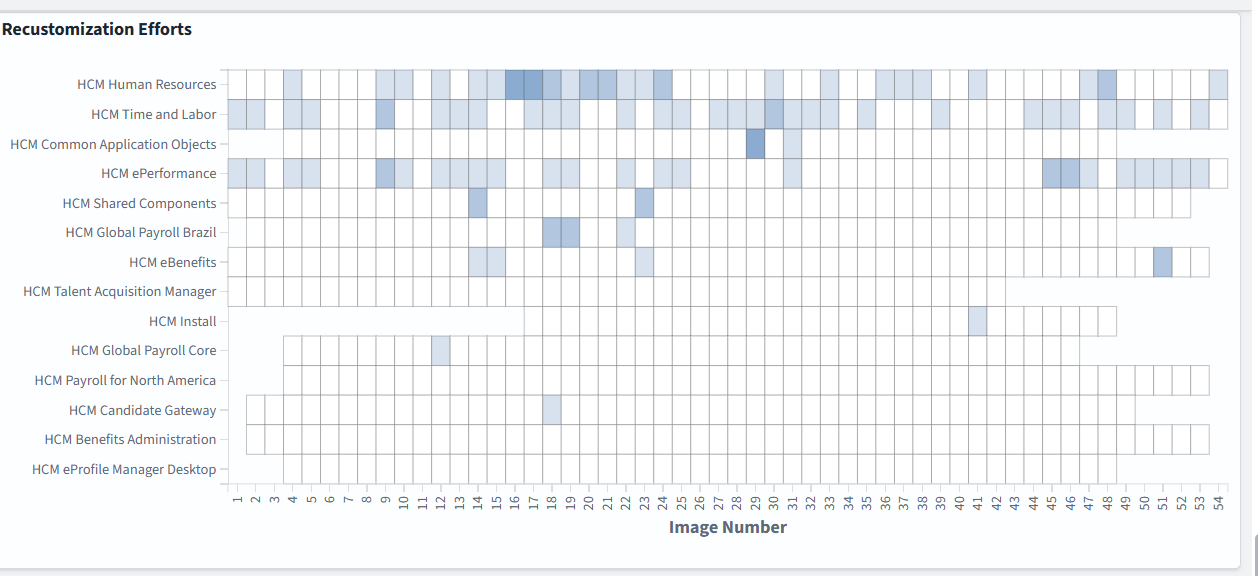
The shaded cells indicate where recustomization effort exists for a product and Image number.
Review the shaded cells to determine which product areas may require additional retrofit analysis.
Customization Over Time
Use the Customization Over Time to view the number of customizations added to Insights over time.
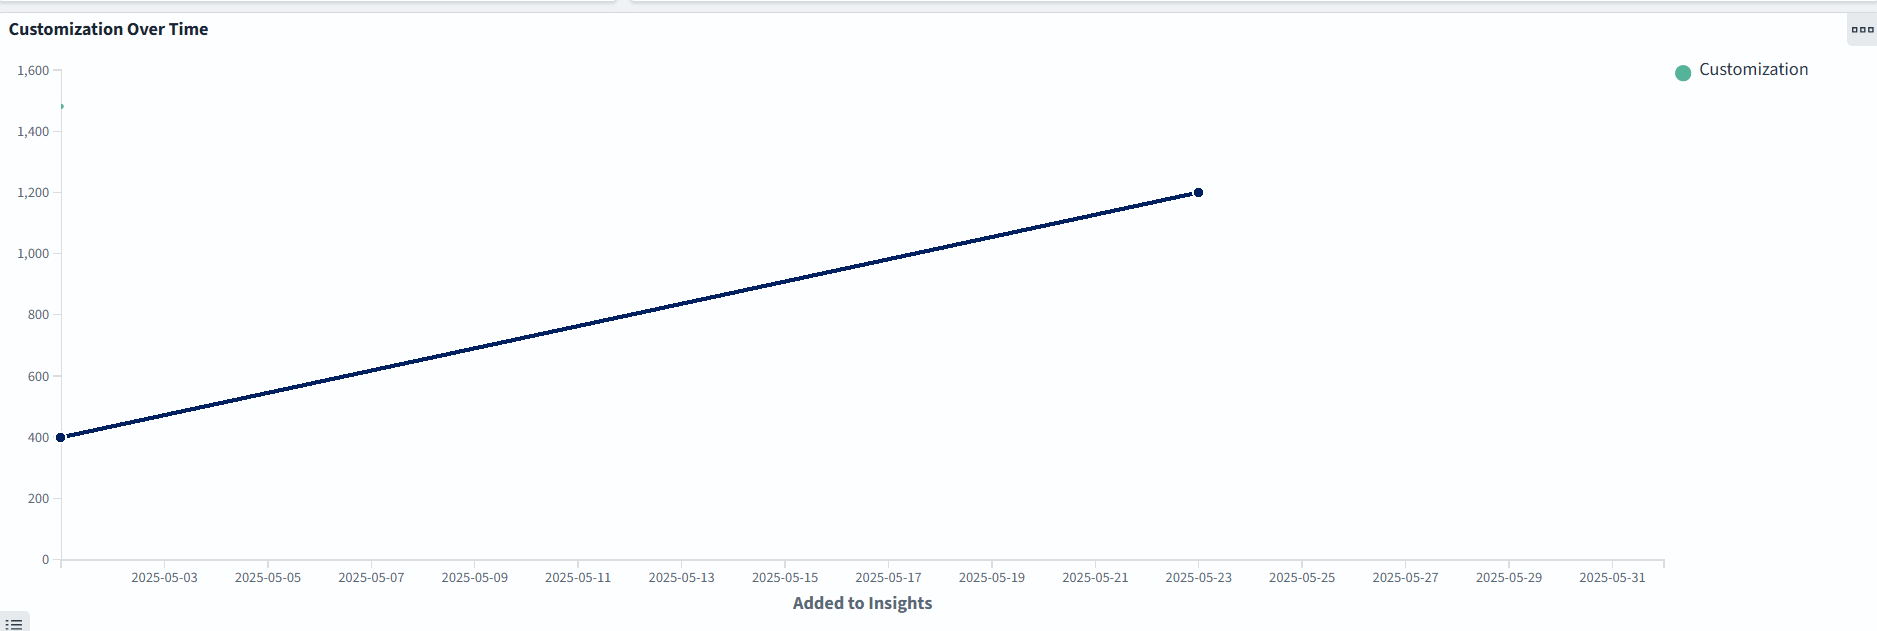
The Added to Insights axis displays the date that the customization data was added to Insights.
The vertical axis displays the number of customizations.
Use this visualization to identify changes in customization volume and to determine whether a specific load or synchronization added customization data to Insights.