Reviewing Bugs and Enhancements Using the Pivot Grid
Displaying Analytics
To display analytics for a specific target database and pivot grid:
-
Expand the Select Target Database folder and click the link for the database to display.
-
Click on one of the pivot grid tiles to open Pivot Grid Viewer.
-
Use the Show Filters icon to display the available filters on the left-hand side of the pivot grid.
-
The grid showing the bugs that match the filter criteria is displayed.
Applying Filters
Use the Show Filters icon to display the available filters on the left-hand side of the pivot grid. Once you select a filter, the pivot grid will be refreshed with the current filters. The following filters are available for the pivot grids:
-
Bug Status
Applied or Unapplied
-
Image
-
Bug Severity
-
Product
-
Product Installed
-
Component
-
Sub Component
Reviewing the Grid
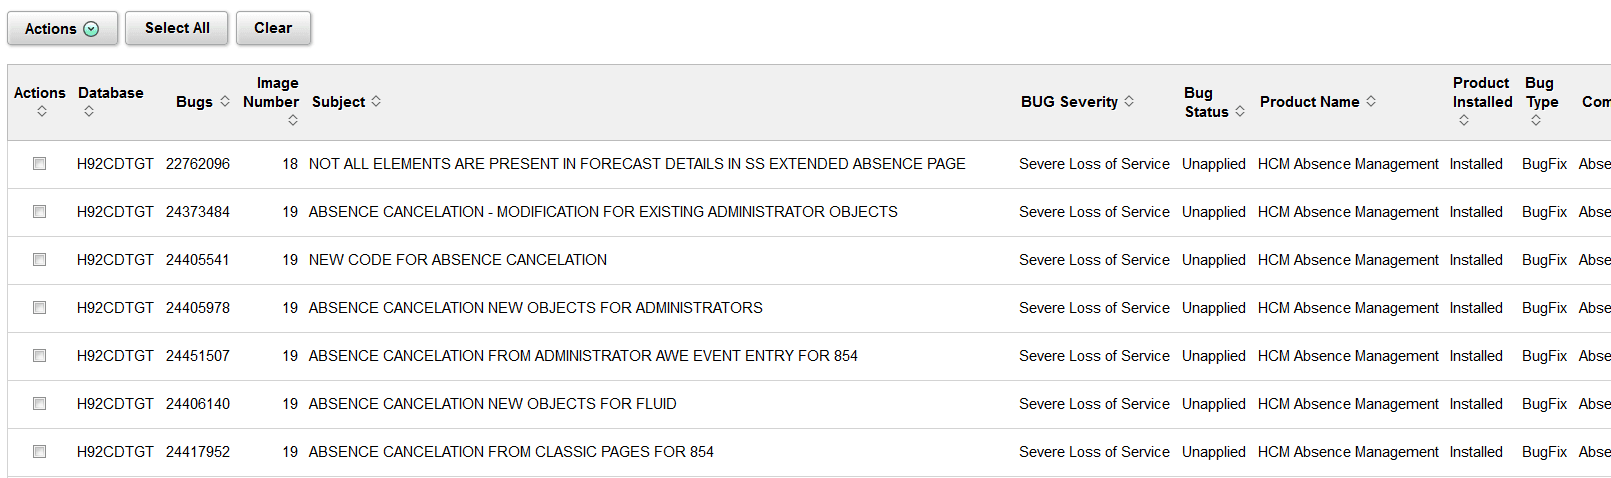
Once you open a pivot grid and apply the filters, all of the bugs meeting the specified criteria are displayed with the following columns:
-
Action check box
-
Database
-
Bugs
-
Image Number
-
Subject
-
Bug Severity
-
Bug Status
-
Product Name
-
Product Installed
-
Bug Type
-
Component
-
Sub Component
-
Posted date
Certain pivot grids have additional columns:
-
Database Bugs by Tags includes columns for Tag Name and Tag Value.
-
Enhancements by Minimum Tools includes a column for Minimum Tools.
-
Applied Bugs by Image Lag includes a column for Image Lag.
This example illustrates the fields and controls on the grid. You can find definitions for the fields and controls later on this page.
| Field or Control | Description |
|---|---|
|
Actions |
After selecting bugs, by checking the Actions column in the grid, use the Actions drop down to select Add to Change Package. |
|
Select All |
Click this button to select all bugs. |
|
Clear All |
Click this button to clear all bugs. |