Viewing Outbound Asynchronous Statistics
Use the Outbound Asynchronous page to search for statistics for outbound asynchronous integrations.
This example illustrates the Outbound Asynchronous page.
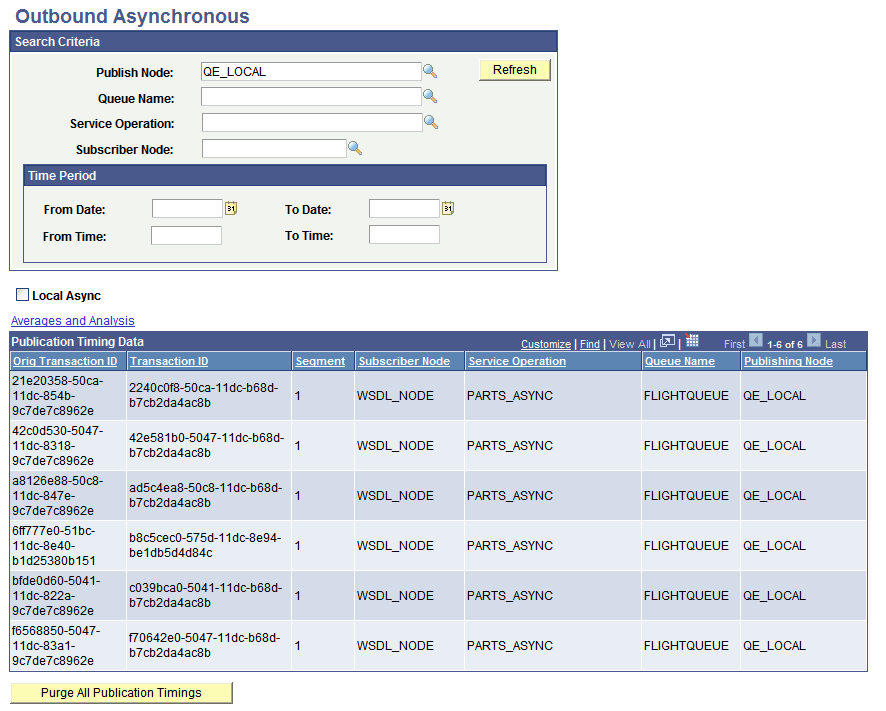
Initial search results for outbound asynchronous messaging system performance statistics display in the Publication Timing Data grid under the Search Criteria dialog box.
The data in grid provides high-level information about the transactions. The fields that appear in this grid are described elsewhere in this section.
See Common Elements Used to View Messaging System Performance Statistics.
Click the Averages and Analysis link to show performance statistics for subscription broker and publication handler processing times.
This example illustrates the fields and controls on the Averages and Analysis page. You can find definitions for the fields and controls later on this page.
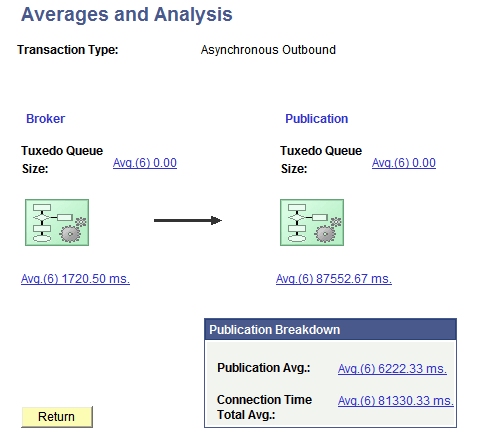
The Averages and Analysis page shows the flow of transactions in graphical format. The flow of the transaction(s) is from left to right: the broker evaluates the transactions and creates the publication contracts, and the publication handler processes the contracts.
The Publication Breakdown box shows the average time for creating the publication contracts as well as average time for connecting to perform the posts to the integration gateway.
The following table lists the links that display on the Averages and Analysis page when viewing statistics for outbound asynchronous transactions. It also lists the names of the pages that open when you click a link and describes the data that may display. The actual data that displays depends on the makeup of the transactions.
| Field or Control | Description |
|---|---|
|
Broker |
The value that displays on the link is the average broker processing time for the selected transactions. Click the link to open the Broker Averages page. Use this page to view the statistics that comprise the broker processing average. They can include:
|
|
(Broker) Tuxedo Queue Size |
The value that displays on the link label is average Oracle Tuxedo queue size at the time the broker processed the request. Click this link to open the Tuxedo Queue Size page. Use this page to view the average queue size during the processing of each service operation. The average queue size is the average number of processes or items in the queue waiting for processing at the time the service operation was processed. |
|
Publication |
The value that displays on the link is the overall average processing time for publication contracts. Click the link to open the Publication Contract Averages. Use this page to view the statistics that comprise the overall publication contract processing average. They can include:
|
|
(Publication) Tuxedo Queue Size |
The value that displays on the link label is the average Oracle Tuxedo queue size at the time the publication handler processed the request. Click this link to open the Tuxedo Queue Size page. Use this page to view the average queue size during the processing of each service operation. The average queue size is the average number of processes or items in the queue waiting for processing at the time the service operation was processed. |
|
Publication Average |
The value that displays on the link label is the average total publication time for the selected transactions. Click the link to open the Publication Contract Averages page. Use the page to view the publication statistics that are included in the publication average. They can include:
|
|
Connection Time Total Avg (Connection Time Total Average) |
The value that displays on the link label is the average connection processing time between the integration gateway and the remote system for the selected contracts. Click the link to open the Averages and Analysis page. Use the page to view connection processing statistics that comprise the connection time average. They can include:
|