Viewing Inbound Synchronous Service Operation Statistics
Results for searching for inbound synchronous statistics appear in under the Search Criteria section of the Inbound Synchronous page.
This example shows sample search results for inbound synchronous statistics.
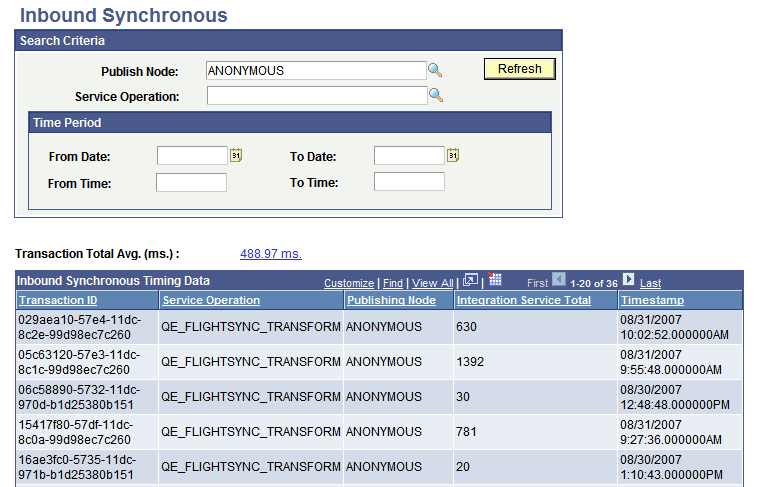
The Inbound Synchronous Timing Data grid in the previous graphic shows partial results of all results returned.
Initial search results for inbound synchronous messaging system performance statistics display in the Inbound Synchronous Timing Data grid under the Search Criteria dialog box.
The data in grid provides high-level information about the transactions. The fields that appear in this grid are described elsewhere in this section.
See Common Elements Used to View Messaging System Performance Statistics.
The value that displays in the Transaction Total Avg field is the average total transaction processing time for the selected transactions. Click the link open the Averages and Analysis page to view the statistics that comprise the total transaction processing time average.
The following example shows the Averages and Analysis page for inbound synchronous transaction statistics
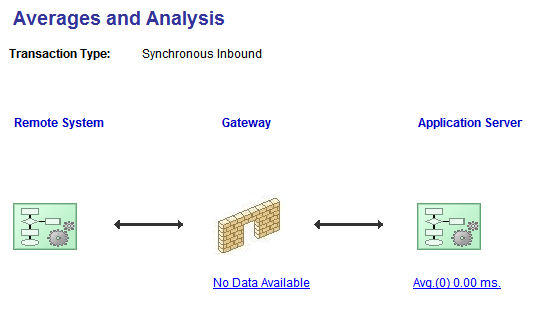
The Averages and Analysis page shows the flow of transactions in graphical format.
The flow of the transactions is from left to right. Remote servers send requests using HTTP to the integration gateway. The integration gateway sends the requests to the application server using Jolt requests.
The following table lists the links that display on the Averages and Analysis page when viewing statistics for inbound synchronous transactions. It also lists the names of the pages that open when you click a link and describes the data that may display. The actual data that displays depends on the makeup of the transactions.
| Field or Control | Description |
|---|---|
|
Remote System |
The value that displays on the link label is the average processing time on the remote server to send the request. The link appears only when the sending remote server is a PeopleSoft system. PeopleSoft systems send application server performance statistics with request messages. Click the link to open the Remote System Averages page. Use the page to view the statistics that comprise the average remote server processing time. The statistics displayed on this page can include:
|
|
Gateway |
The value that displays on the link label is the average processing time for the selected transactions on the integration gateway. Click the link to open the Gateway Averages page. Use the page to view the statistics that comprise the integration gateway processing average. They can include:
|
|
Application Server |
The value that displays on the link label is the average processing time on the application server. Click the link to open the Local Server Averages page. Use this page to view the statistics that comprise the application server process average. They can include:
|