Using the Monitor Queues Page and Sample Monitor - Queue Statistics Page
Access the Monitor Queues page using the following navigation path:
This example illustrates the fields and controls on the Monitor Queues page.
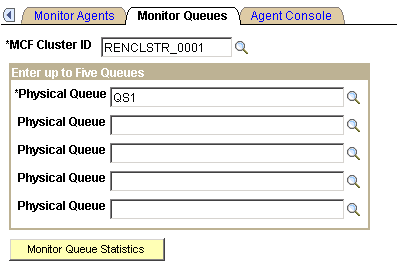
Select the MCF cluster and up to five physical queues on that cluster to be monitored.
After you click Monitor Queue Statistics, a new browser window appears.
Note:
To enable the new browser window to appear, disable any pop-up blocking software for your browser.
This example illustrates the fields and controls on the Sample Monitor - Queue Statistics page. You can find definitions for the fields and controls later on this page.
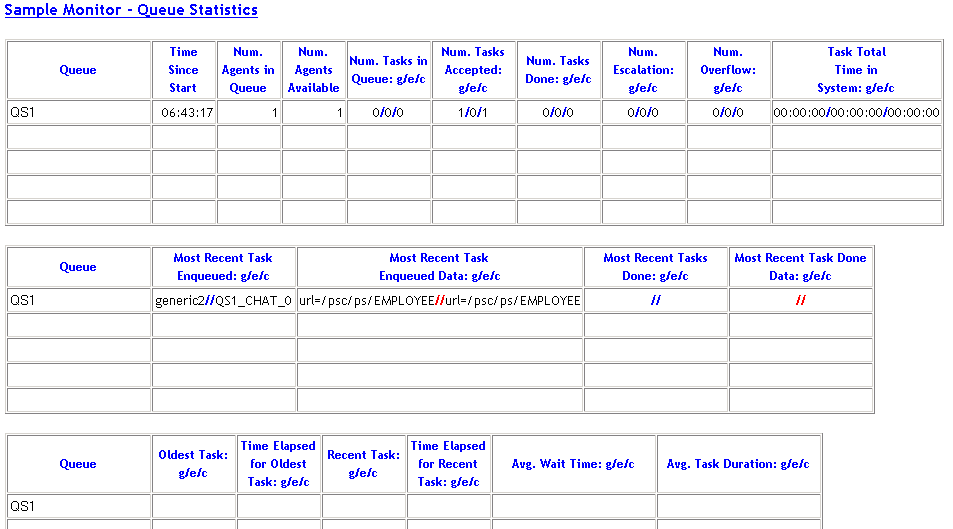
Queue Statistics 1
The first queue statistics table displays data that does not change frequently. The table displays information that is published by the JSMCAPI group.onStat1 event.
| Field or Control | Description |
|---|---|
|
Queue |
Displays an identifier for this queue. The value returned is |
|
Time Since Start |
The duration since this queue was started (application server domain start). The value returned is |
|
Num. Agents in Queue (number of agents in queue) |
The number of agents that are currently logged in to this queue. The value returned is |
|
Num. Agents Available (number of agents available) |
The number of agents that are currently logged in to this queue with an available status. The value returned is |
|
Num. Tasks in Queue: g/e/c (number of tasks in queue) |
The number of tasks that are currently on this queue, by task type. The value returned is |
|
Num. Tasks Accepted: g/e/c (number of tasks accepted) |
The number of accepted tasks that are currently on this queue, by task type. The value returned is |
|
Num. Tasks Done: g/e/c (number of tasks done) |
The number of tasks on this queue that have been completed, by task type. The value returned is |
|
Num. Escalation: g/e/c (number of escalation) |
The number of escalated tasks on this queue, by task type. The value returned is |
|
Num. Overflow: g/e/c (number of overflow) |
The number of overflow tasks on this queue, by task type. The value returned is |
|
Task Total Time in System: g/e/c |
Displays the total duration of the most recently completed task in the system. The total time is the difference between the time that the task was enqueued and the time at which it was marked done. The value returned is |
Queue Statistics 2
The second queue statistics table displays data that changes frequently. The table displays information that is published by the JSMCAPI group.onStat1 event.
| Field or Control | Description |
|---|---|
|
Most Recent Task Enqueued: g/e/c |
Identifies the task that was most recently enqueued on this queue, by task type. The value returned is |
|
Most Recent Task Enqueued Data: g/e/c |
Displays data for the most recently enqueued task on this queue, by task type. The value returned is |
|
Most Recent Tasks Done: g/e/c |
Identifies the task that was most recently completed, by task type. The value returned is |
|
Most Recent Task Done Data: g/e/c |
Displays data for the most recently completed tasks, by task type. The value returned is |
Queue Statistics 3
The table displays information that is published by the JSMCAPI group.onStat2 event.
| Field or Control | Description |
|---|---|
|
Oldest Task: g/e/c |
Identifies the oldest enqueued and accepted task on this queue, by task type. The value returned is |
|
Time Elapsed for Oldest Task: g/e/c |
Displays the duration that the oldest task on this queue has been enqueued, by task type. The value returned is |
|
Recent Task: g/e/c |
Identifies the most recent task that was enqueued and accepted on this queue, by task type. The value returned is |
|
Time Elapsed for Recent Task: g/e/c |
Displays the duration that the most recent task on this queue has been enqueued, by task type. The value returned is |
|
Avg. Wait Time: g/e/c (average wait time) |
Displays the average time between a task being enqueued and being accepted, by task type. The value returned is |
|
Avg. Task Duration: g/e/c (average task duration) |
Displays the average duration before a task is completed. The value returned is The average task duration is calculated by referencing a list of completed tasks. The size of that list is determined by the donelistsize parameter that is set on the Cluster Tuning page. |