Using the Monitor Agents Page and Sample Monitor - Agent States Page
Access the Monitor Agents page using the following navigation path:
This example illustrates the fields and controls on the Monitor Agents page.
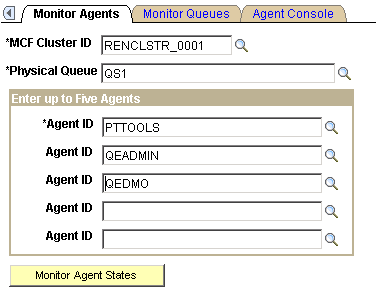
Select the MCF cluster, physical queue on that cluster, and up to five agents on that queue to be monitored.
After you click Monitor Agent States, a new browser window appears.
Note:
To enable the new browser window to appear, disable any pop-up blocking software for your browser.
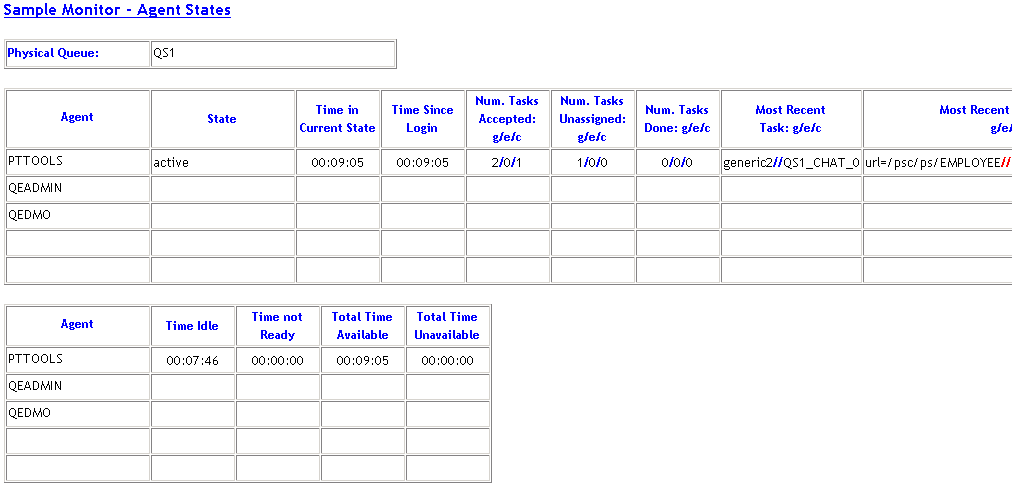
This example illustrates the fields and controls on the Sample Monitor - Agent States page. You can find definitions for the fields and controls later on this page.
Physical Queue
The ID of the physical queue that is being monitored appears in the first table.
Agent Statistics Table 1
The first agent statistics table displays information that is published by the JSMCAPI user.onStat1 event.
| Field or Control | Description |
|---|---|
|
Time in Current State |
Displays the duration of the agent's current state. The value returned is |
|
Time Since Login |
Denotes the duration since the agent logged in. The value returned is |
|
Num. Tasks Accepted: g/e/c (number of tasks accepted) |
Displays the number of tasks in each task type that the agent has accepted since login. The value returned is |
|
Num. Tasks Unassigned: g/e/c (number of tasks unassigned) |
Displays the number of tasks in each task type that have been unassigned from the agent. Returned by |
|
Num. Tasks Done: g/e/c (number of tasks done) |
Displays the number of tasks in each task type that the agent has completed. Returned by |
|
Most Recent Task: g/e/c |
Identifies the most recent task that was accepted since login for each task type. Returned by |
|
Most Recent Task Data: g/e/c |
Displays data on the most recent task that was accepted since login for each task type. Returned by |
Agent Statistics Table 2
The second agent statistics table displays information that is published by the JSMCAPI user.onStat2 event.
| Field or Control | Description |
|---|---|
|
Time Idle |
Displays the duration of time during which the agent has been idle. An agent is considered to be idle from the time the agent logs on until the agent accepts a task, and during the time between completing the last accepted task and accepting another task. The value returned is |
|
Time not Ready |
Displays the duration of time during which the queue could not assign tasks to the agent because the agent's maximum workload has been reached. The value returned is |
|
Total Time Available |
Displays the total amount of time that the agent has been in an available status. The value returned is |
|
Total Time Unavailable |
Displays the total amount of time that the agent has been in an unavailable status. The value returned is |