Accessibility Settings for Charts
Use the Chart Options page to specify system-wide accessibility settings. When accessibility is enabled for a chart type and the user signs in with screen reader mode on, the system generates the chart data in an HTML table that is in an accessible format for assistive technologies. For some chart types, this “accessible table” is in addition to the graphical rendering of the chart; in other cases, the accessible table is the only output generated.
-
For the Chart class and the gauge classes, the accessible table is in addition to the graphical rendering of the chart.
-
For the Gantt class, the accessible table is the only output generated.
Navigation:
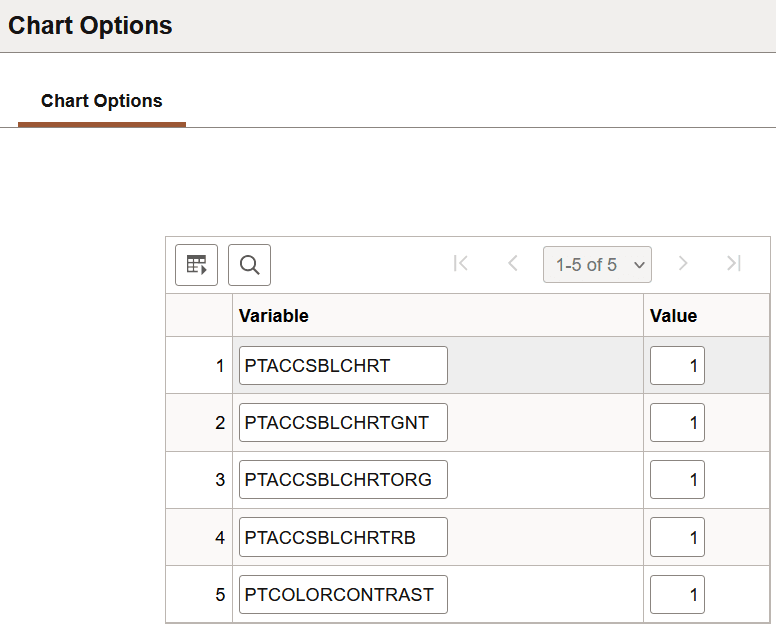
This example illustrates the fields and controls on the Chart Options page.
| Field or Control | Description |
|---|---|
|
VARIABLE |
Specify the chart type by variable name:
|
|
VALUE |
Specify the system accessibility setting:
Note: The delivered setting is for accessibility to be enabled. |