Designing Organization Chart Nodes
This section describes the basic design of an organization chart node and explains how to use node display templates to configure more complex organization chart nodes.
Using Node Display Templates
You can optionally define node display templates for more precise control over the display characteristics of descriptors on a node.
A node display template is keyed to a single organization chart node row, using the PTNODE_DISPLAY_ID field. A node display template comprises the set of rows that share a value in PTNODE_DISPLAY_ID. Conversely, an organization chart node is associated with a single node display template.
Each row in the node display template defines one descriptor.
Using a node display template, you control:
-
Which descriptors appear on the node. Only descriptors included in the node display template and that have PT_DISPLAY_FLAG set to “Y” will appear in the node.
-
Display type of descriptors (this overrides display types set in PTNDDESCnLINKABLE).
-
Line position and display order of a descriptor.
-
Number of display items on a node line.
-
Spacing between descriptors.
You can associate a node display template with one or more schemas, or zoom levels. Each schema level assigns different display characteristics to the descriptors.
See Implementing Zoom Schemas (Optional).
You can define your chart to use different node display templates for different nodes by assigning different values to PTNODE_DISPLAY_ID. For example, you might choose to configure the nodes for executive management to display names and photos, but no telephone numbers, locations, emails, or IM presence, while nodes for everyone else display telephone numbers, locations, and emails, but not photos.
Implementing Node Display Templates
To implement node display templates:
-
Create a node display record that includes a clone of the PTNODE_DISP_SBR.
-
Add PeopleCode to set the node display record and the node display rowset.
-
For example:
&ocPBOrg.SetNodeDisplayDataRecord(Record.&recDisplay);
&ocPBOrg.SetNodeDisplayData(&rsDisplay);
See “PTNODE_DISP_SBR” in Organization Chart Subrecord Definitions.
Example: Designing a Node
This section demonstrates how to lay out a node that looks like the following example:
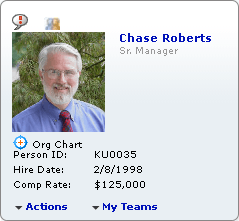
Node Descriptors
The organization chart node (PTORGNODE_SBR) sample data in the following table generates the descriptors in the previous node example (for simplicity, not all fields are shown):
| Field | Data |
|---|---|
|
PTCHART_NODE |
CROBE |
|
PTPARENT_CHART_ND |
BSTOM |
|
PTND_DISPLAY_ORDER |
3 |
|
PTNODE_DESCR1 |
Chase Roberts |
|
PTNDDESC1LINKABLE |
Y |
|
PTNODE_DESCR2 |
Sr. Manager |
|
PTNODE_DESCR3 |
My Teams |
|
PTNDDESC3LINKABLE |
D |
|
PTNODE_DESCR4 |
KU0035 |
|
PTNODE_DESCR5 |
2/8/1998 |
|
PTDESCR5_ICON_POS |
L |
|
PTNODE_DESCR6 |
$125,000 |
|
PTNDDESC6LINKABLE |
N |
|
PTNODE_DESCR7 |
Actions |
|
PTNDDESC7LINKABLE |
A |
|
PTDESCR7_ICON_POS |
L |
|
PTADJUSTFORNULLS |
Y |
|
PTNODE_DISPLAY_ID |
DEMO17 |
|
PTPHOTO_START |
2 |
|
PTNODE_DESCR8 |
Org Chart |
|
PTDESCR8_ICON_IMG |
QE_ORG_CHART_ICON |
|
PTDESCR8_ICON_POS |
L |
|
PTNDDESC8LINKABLE |
Y |
|
PTNODE_DESCR9 |
Person ID: |
|
PTNODE_DESCR10 |
Hire Date: |
|
PTNODE_DESCR11 |
Comp Rate: |
|
PTNODE_DESCR12 |
|
|
PTNDDESC12LINKABLE |
|
|
PTNODE_DESCR13 |
Org chart |
|
PTDESCR13_ICON_IMG |
QE_SUCCSORGCHART |
|
PTDESCR3_DD_ID |
DEMO17B |
|
PTDESCR7_DD_ID |
DEMO17 |
Node Display Template
The organization chart node display (PTNODE_DISP_SBR) data looks like this:
| PTNODE _DISPLAY_ID | PT_SCHEMA_LEVEL_ID | PT_CNT_ID | PT_NODE_VIEW | PT_LINE_ NUM | PTND_ DISPLAY_ ORDER | PT_DISPLAY_TYPE | PT_PADDING_ LEFT | PT_ PADDING_ RIGHT |
|---|---|---|---|---|---|---|---|---|
|
DEMO17 |
3 |
PTNODE_DESCR12 |
VIEW1 |
1 |
1 |
M |
Y |
0 |
|
DEMO17 |
3 |
PTNODE_DESCR13 |
VIEW1 |
1 |
2 |
I |
Y |
0 |
|
DEMO17 |
3 |
PTNODE_DESCR1 |
VIEW1 |
2 |
1 |
Y |
Y |
0 |
|
DEMO17 |
3 |
PTNODE_DESCR2 |
VIEW1 |
3 |
1 |
N |
Y |
0 |
|
DEMO17 |
3 |
PTNODE_DESCR8 |
VIEW1 |
4 |
1 |
Y |
Y |
0 |
|
DEMO17 |
3 |
PTNODE_DESCR9 |
VIEW1 |
5 |
1 |
N |
Y |
0 |
|
DEMO17 |
3 |
PTNODE_DESCR4 |
VIEW1 |
5 |
2 |
N |
Y |
0 |
|
DEMO17 |
3 |
PTNODE_DESCR10 |
VIEW1 |
6 |
1 |
N |
Y |
0 |
|
DEMO17 |
3 |
PTNODE_DESCR5 |
VIEW1 |
6 |
2 |
N |
Y |
0 |
|
DEMO17 |
3 |
PTNODE_DESCR11 |
VIEW1 |
7 |
1 |
N |
Y |
0 |
|
DEMO17 |
3 |
PTNODE_DESCR6 |
VIEW1 |
7 |
2 |
N |
Y |
0 |
|
DEMO17 |
3 |
PTNODE_DESCR3 |
VIEW1 |
8 |
2 |
D |
Y |
0 |
|
DEMO17 |
3 |
PTNODE_DESCR7 |
VIEW1 |
8 |
1 |
A |
Y |
0 |
Default Node Design
Node display templates are a feature of PeopleTools Release 8.52. Organization charts created prior to PeopleTools Release 8.52 continue to be supported using the default node design.
Oracle recommends using node display templates for PeopleTools Release 8.52 and later organization charts. If you choose not to implement the optional node display templates, your organization chart will follow the default node design. An organization chart that is defined using the default node design has the following characteristics:
-
If an icon image is specified in the PTNDMAINICON_IMAGE field, it appears on the first line, at the right.
-
If a node image, such as a photo, is specified (PTORGCHRTIMG), it appears by default on the left, beginning on line two. You can use the ImageLocation property to specify left or right position.
-
Each descriptor appears on a separate line. The node displays the first seven descriptors, ordered by the descriptor number.
-
PTDESCR_UNDER_IMG specifies the first line that appears under the image. Previous lines appear beside the image.
Adjusting Node Sizing
By default, organization chart nodes are sized dynamically based on the contents of the node and can vary from node to node.
For a vertical organization chart, the width of each node is based on the width of the data in the node. Width can vary from node to node. All the nodes in a given row are the same height, based on height of the tallest node, but node height can vary from row to row.
For a horizontal organization chart, the height of each node is based on the height of the data in the node. Height can vary from node to node. All the nodes in a given column are the same width, based on width of the widest node, but node width can vary from column to column.
You can use the NodeProportion property to control how nodes are sized on a chart. NodeProportion takes the following values:
0 = Variable node sizing. (Default.)
1 = Uniform node height.
2 = Uniform node width.
3 = Uniform node height and width.
4 = Square nodes.
The following example shows a vertical organization chart with uniform node height and width (NodeProportion = 3):
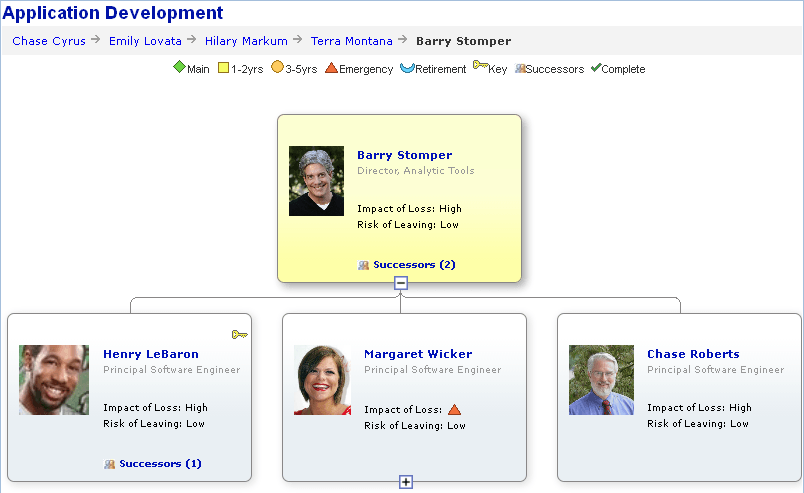
Applying constant node widths can create nodes with extra blank space in the node. You can reduce the node width by reducing value of the NodeMaxDisplayDescLength property.