SetDataXAxis method: Chart class
Syntax
SetDataXAxis(Record_Name.Field_Name)Description
Use the SetDataXAxis method to specify the groups along the x-axis.
If this value is not set or Null, the y values are plotted along the x-axis in groups labeled by their order number.
The order of the data is plotted in the order of the data in the record.
By default, the labels along the x-axis are populated by the value of this field.
Parameters
| Parameter | Description |
|---|---|
|
Record_Name.Field_Name |
Specify the name of the record, and the field on that record, that contains the data for the x-axis for the chart. |
Returns
None.
Example
&cChart = GetChart(PB_CHART_DUMREC.PB_CHART_FIELD);

&cChart.SetData(Record.PB_CHART_RECORD);
&cChart.SetDataSeries(PB_CHART_RECORD.PB_CHART_PRODUCT);
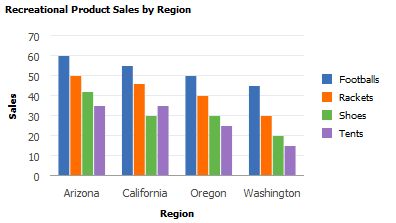
&cChart.SetDataXAxis(PB_CHART_RECORD.PB_CHART_REGION);
&cChart.SetDataYAxis(PB_CHART_RECORD.PB_CHART_SALES);
In the following example, the y-axis is set to a numeric amount, while the x-axis is set to the region:
Related Topics