Using the ToolTipLabel Class
The ToolTipLabel class is used in conjunction with the Chart class to display custom tooltips (also referred to as “data hints” or “hover text) on chart data points thereby overriding the default tooltips that are automatically created from the chart data.
Using the ToolTipLabel Class with the Chart Class
The essential steps to use the ToolTipLabel class are:
-
Create an instance of the ToolTipLabel class in PeopleCode by using the GetToolTip built-in function:
&label1 = GetToolTip(); -
Set the ToolTipLabelType and ToolTipLabelValue properties on each ToolTipLabel object that you created.
-
Add the object to an array of ToolTipLabel objects:
&tooltip_labels = CreateArray(&label1, &label2); -
Pass the array into the SetToolTipLabels method of the Chart object:
&cChart.SetToolTipLabels(&tooltip_labels);
Creating Custom Tooltips
To create custom tooltips similar to the following example, you would create three instances of the ToolTipLabel class.
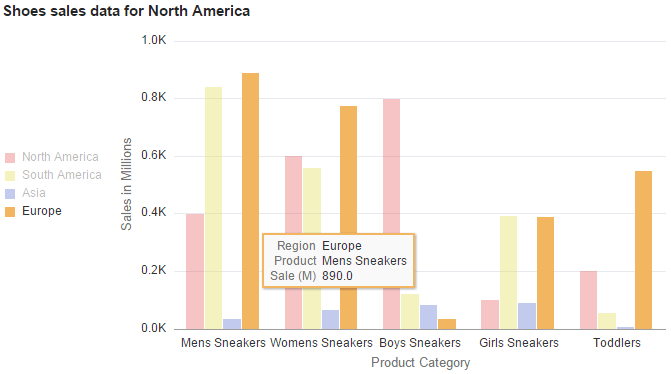
In the preceding example, the custom tooltip displays the x-axis data (%TooltipLbl_X), y-axis data (%TooltipLbl_Y), and the data series (%TooltipLbl_Series). The following PeopleCode program would generate these custom tooltips:
/* Declare and instantiate a chart object */
Component Chart &QEChart;
Component TooltipLabel &label1, &label2, &label3;
Component array of TooltipLabel &tooltip_labels;

&QEChart = GetChart(QE_CHART_T2_CHR.QE_CHART_T2_CHRTFL);
&QEChart.Reset();

/* Set the chart parameters for chart descriptions */
&QEChart.Type = %ChartType_2DBar;
&QEChart.MainTitle = "Shoes sales data for North America";
&QEChart.XAxisTitle = "Product Category";
&QEChart.YAxisTitle = "Sales in Millions";
&QEChart.HasLegend = True;

/* Set the chart data record and specify x-axis, y-axis, and series data */
&QEChart.SetData(Record.QE_CHART_T1_PRO);
&QEChart.SetDataXAxis(QE_CHART_T1_PRO.QE_CHART_T1_PROD);
&QEChart.SetDataYAxis(QE_CHART_T1_PRO.QE_CHART_T1_SALES);
&QEChart.SetDataSeries(QE_CHART_T1_PRO.QE_CHART_T1_REGION);
&label1 = GetToolTip();
&label1.ToolTipLabelType = %TooltipLbl_X;
&label1.ToolTipLabelValue = "Product";
&label2 = GetToolTip();
&label2.ToolTipLabelType = %TooltipLbl_Series;
&label2.ToolTipLabelValue = "Region";
&label3 = GetToolTip();
&label3.ToolTipLabelType = %TooltipLbl_Y;
&label3.ToolTipLabelValue = "Sale (M)";
&tooltip_labels = CreateArray(&label1, &label2, &label3);
&QEChart.SetToolTipLabel(&tooltip_labels);