Using the Series Class
The Series class is used in conjunction with the Chart class to override the default chart type (as defined by the Type property for the Chart object) for selected members of the data series. (The field representing the data series is specified using the SetDataSeries method.) Using the Series class allows you to render more than one chart type simultaneously.
The Series class can only be used in conjunction with bar charts, horizontal bar charts, stacked bar charts, horizontal stacked bar charts, and the line charts.
Using the Series Class with the Chart Class
The essential steps to use the Series class are:
-
Specify the field representing the data series for the chart.
&cChart.SetDataSeries(RECORD.FIELD); -
Create an instance of the Series class in PeopleCode by using the GetSeries built-in function:
&series1 = GetSeries(); -
Set the Name and Type properties on each instance of the Series class that you created.
Note:
The value of the Name property must match exactly the value of a member in the data series as specified by either the SetDataSeries method or set by the SetSeriesLabel method.
-
Add the instance to an array of Series instances:
&all_series = CreateArray(&series1);Note:
Add a separate instance of the Series class to this array for each member of the data series that you want to override the default chart type. Members not explicitly added to this array will inherit the default chart type. Alternatively, you can use the %SeriesType_Inherit constant to specify that a data series member inherit the default chart type.
-
Pass the array into the SetSeries method of the Chart class:
&cChart.SetSeries(&all_series);
Overriding the Chart Type Using the Series Class
In the following example of a bar chart, two of the five series are displayed as different chart types:
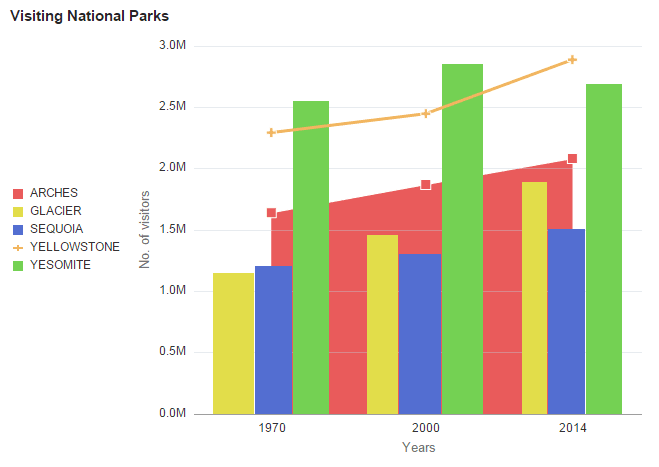
To produce a bar chart similar to the preceding example that uses a different chart type for the first and the fourth of five series, you would create two instances of the Series class. In this example, the Name property matches the value of the field as specified by the SetDataSeries method:
Component Chart &oChart;

&oChart = GetChart(QE_JET_CHARTWRK.QE_JET);
&oChart.Reset();
&oChart.Type = %ChartType_2DBar;

&oChart.SetData(Record.QE_CHART_NPARKS);

&oChart.SetDataYAxis(QE_CHART_NPARKS.QE_VISITORS);
&oChart.SetDataXAxis(QE_CHART_NPARKS.QE_YEARS);

&oChart.SetDataSeries(QE_CHART_NPARKS.QE_PARKNAME);

&oChart.XAxisTitle = "Years";
&oChart.YAxisTitle = "No. of visitors";
&oChart.MainTitle = "Visiting National Parks";

&oChart.HasLegend = True;
&oChart.LegendPosition = %ChartLegend_Left;

Local Series &S1, &S2;

&S1 = GetSeries();
&S1.Name = "YELLOWSTONE";
&S1.Type = %SeriesType_Line;

&S2 = GetSeries();
&S2.Name = "ARCHES";
&S2.Type = %SeriesType_Area;

&oChart.SetSeries(CreateArray(&S1, &S2));