Common Elements on a Visualization
This topic discusses some of the common elements on the visualization. For more information on the other elements on the OpenSearch Dashboards visualizations, refer to the OpenSearch Dashboards documentation [2.3.0], which is available on www.opensearch.org.
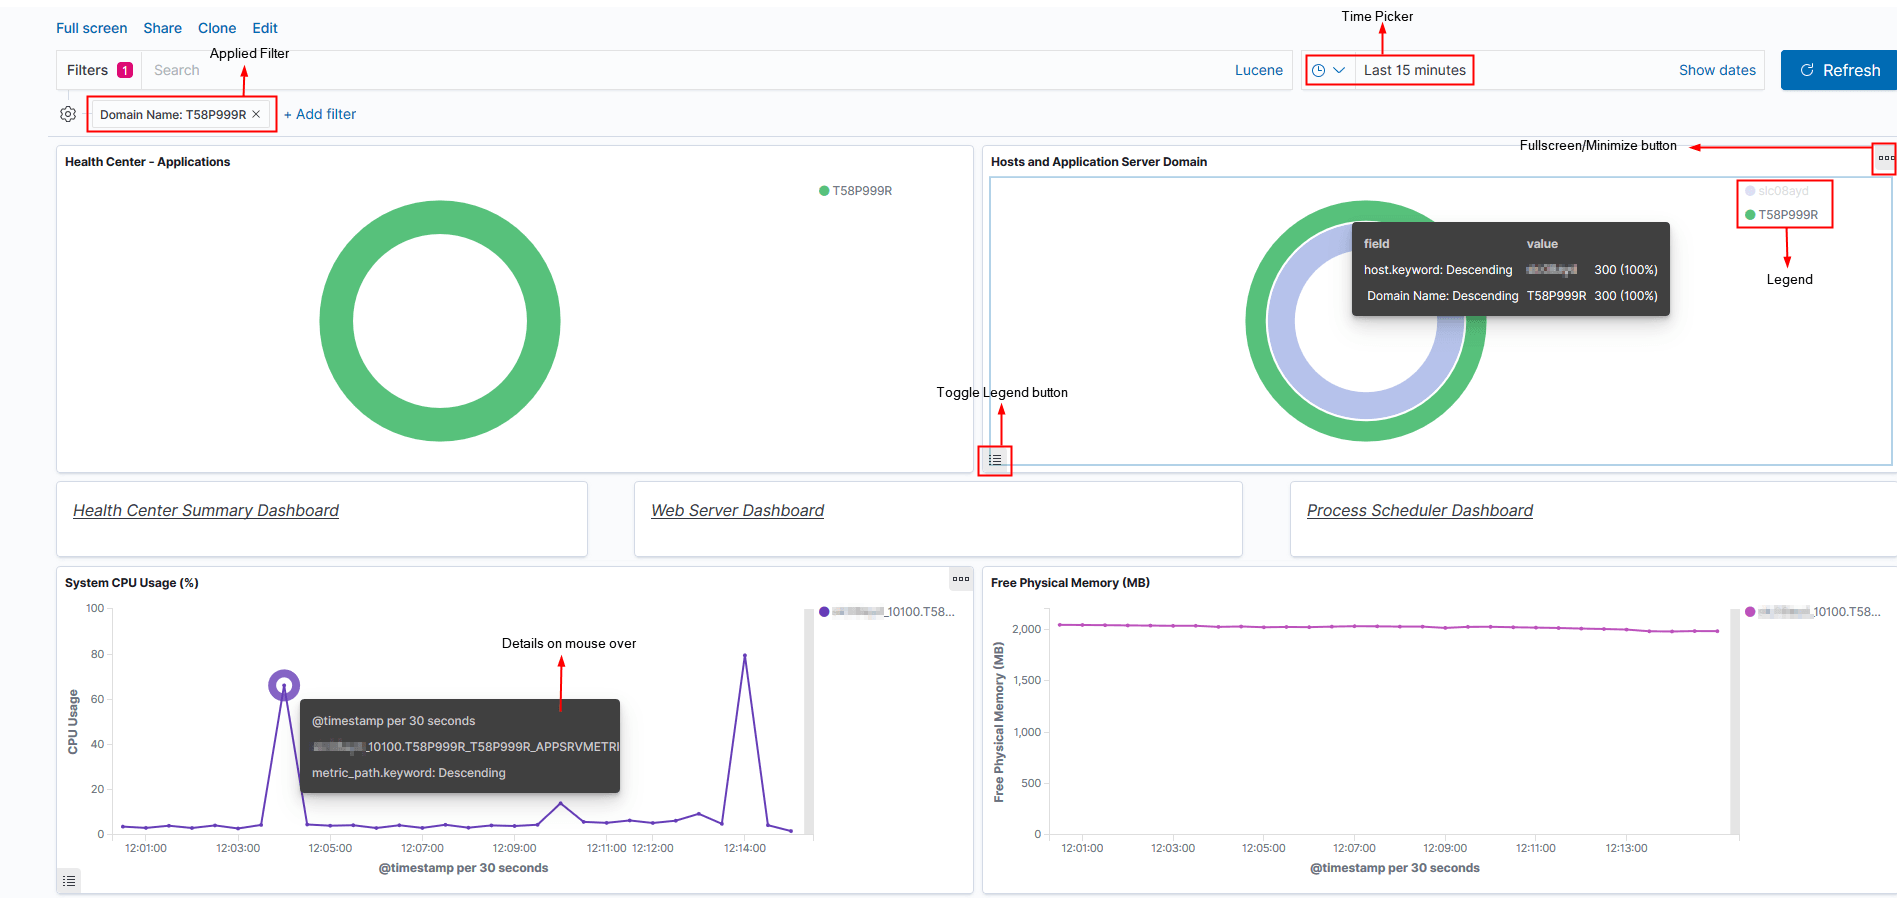
This example illustrates the common elements on a visualization.
| Term | Definition |
|---|---|
|
Applied Filter |
Use the filter option to filter data on the visualization. |
|
Time Picker |
Use the Time Picker area to restrict the search results to a specific time period. The time picker enables you to set the filter to view real time data and historical data. |
|
Fullscreen/Minimize Option |
Use the Fullscreen/Minimize Option button to enlarge the selected visualization. |
|
Legend |
OpenSearch Dashboards randomly uses different colors in a legend. You can collapse the legend if you want more real estate on the selected visualization. |
|
Toggle Legend button |
Enables you to close and display legend. |
|
Details on mouse over |
Hover the mouse over a chart to view details. |