Viewing the Health Center Summary Dashboard
Access the Health Center Summary dashboard. ()
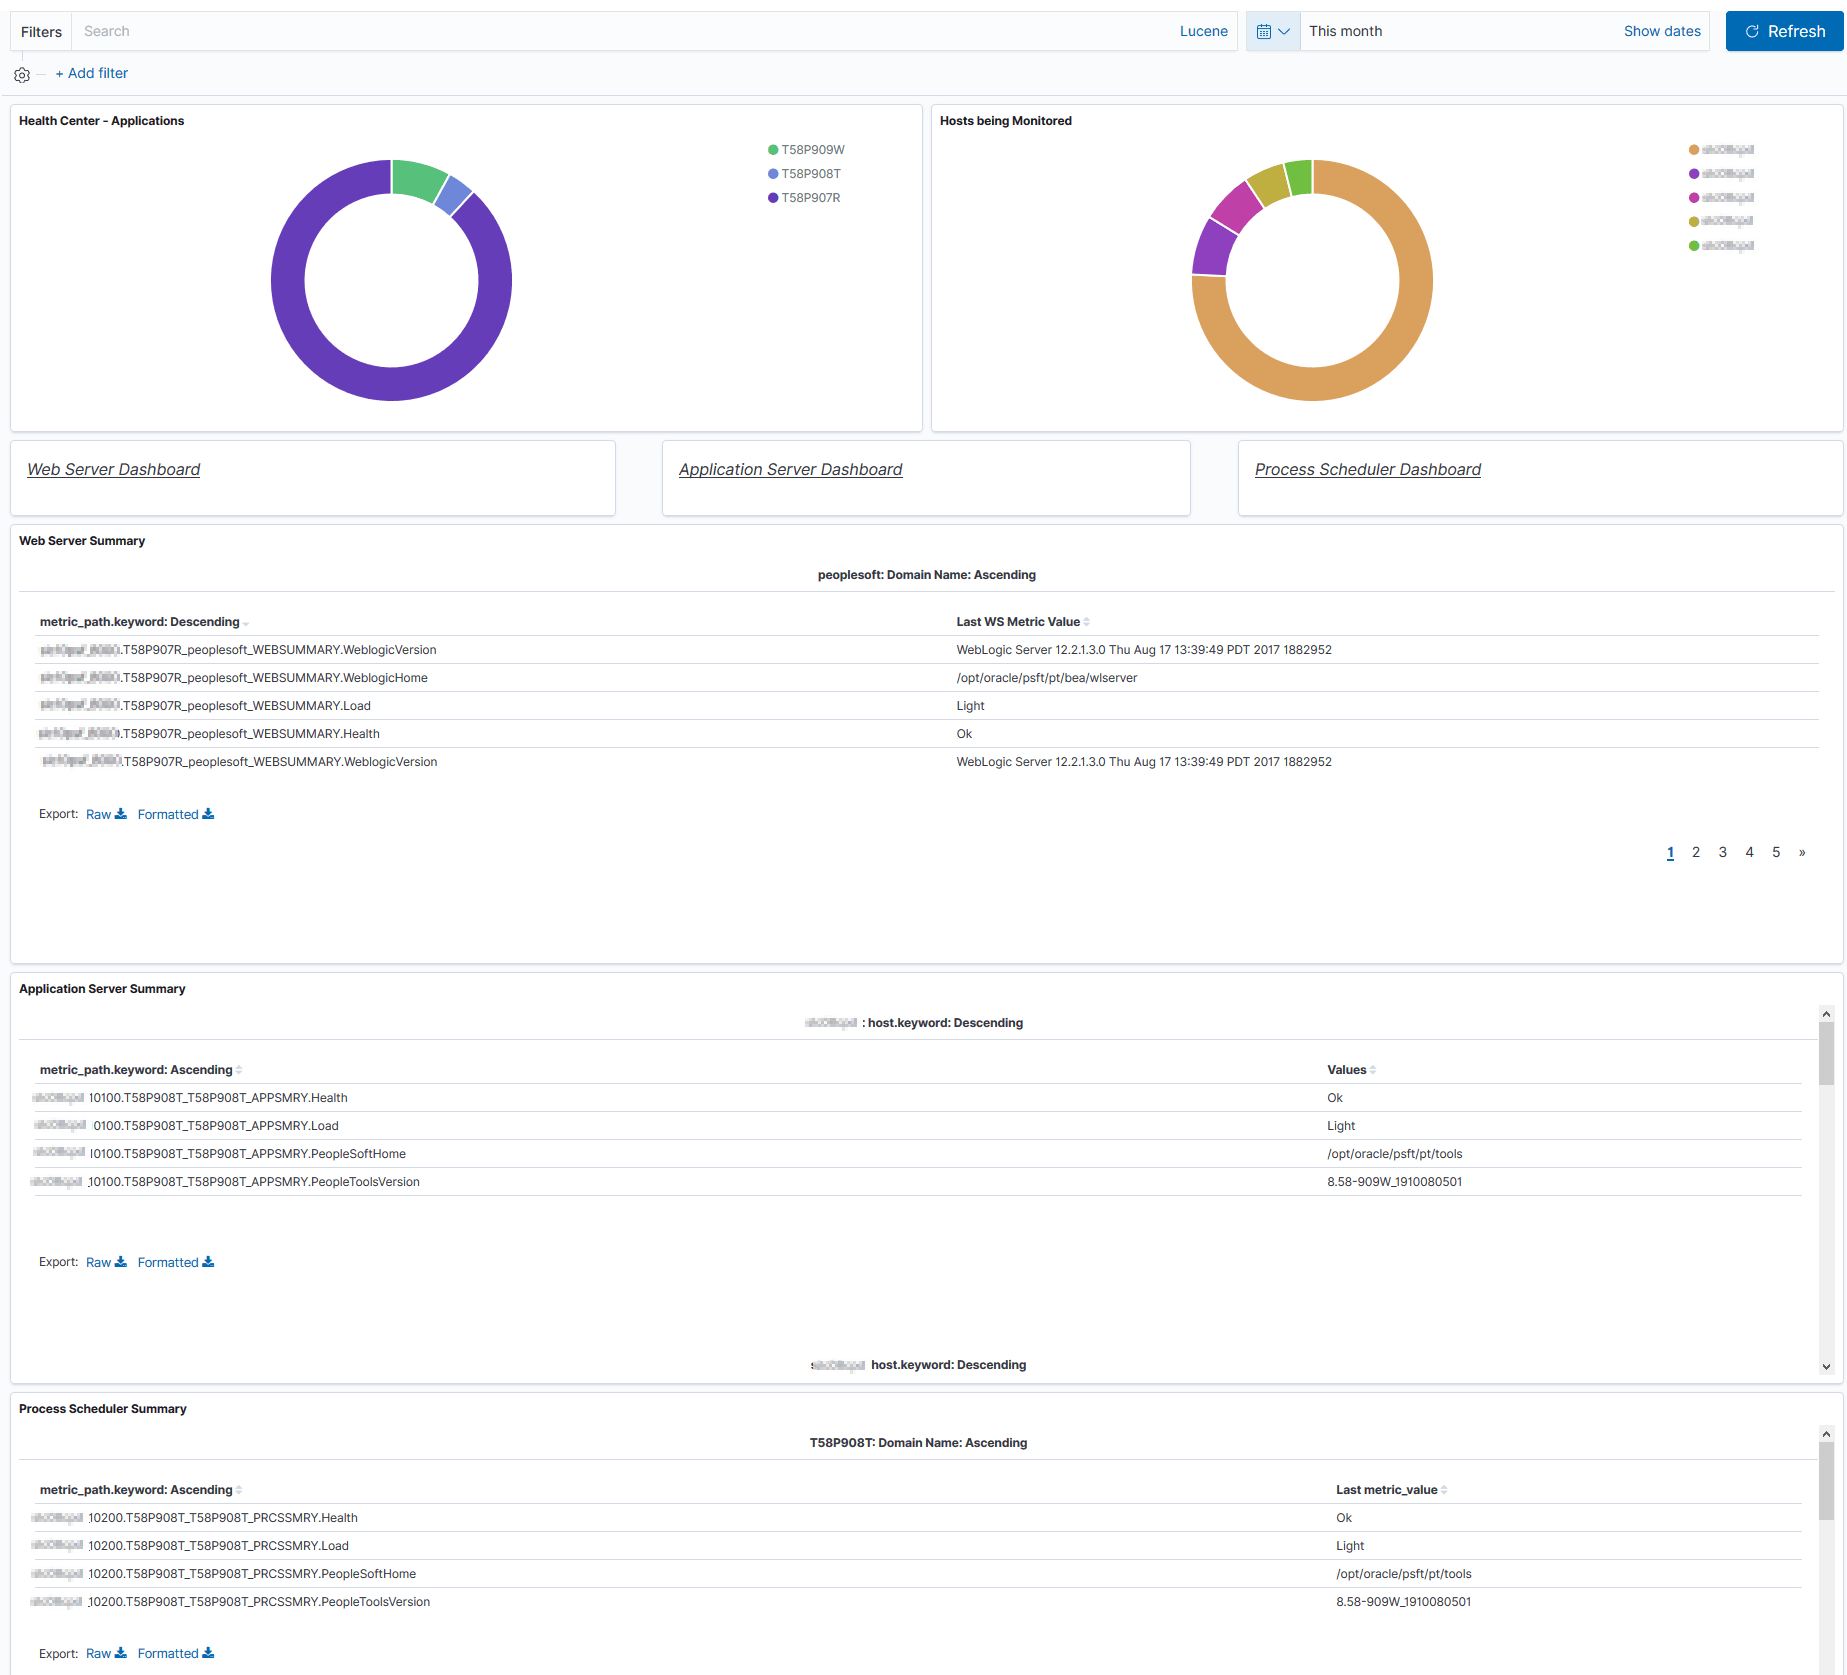
The dashboard displays monitoring data for the participating domains and hosts, Web server, Application server, and Process Scheduler server.
This example illustrates the fields and controls on the Health Center Summary dashboard. You can find definitions for the fields and controls later on this page.
| Field or Control | Description |
|---|---|
|
Health Center - Applications |
The Health Center - Applications area displays the applications participating in the monitoring system as a donut chart. Each segment on the donut chart represents an application. The legend indicates the color for each application. To view the monitoring details of a specific application, click the respective segment for an application. On clicking the respective segment of the application, the system prompts for a confirmation to apply the filter. Upon your confirmation, filtered data or charts are displayed. |
|
Hosts being Monitored |
The Hosts being monitored area displays the hosts participating in the monitoring system as a donut chart. Each segment on the donut chart represents a host. The legend indicates the color for each host. To view the monitoring details of a specific host, click the respective segment for a host. On clicking the respective segment of the host, the system prompts for a confirmation to apply the filter. Upon your confirmation, filtered data or charts are displayed. |
|
Web Server Summary |
Displays a summary of all participating Web server domains. You can scroll the area to see the details, such as:
The health and load status of a server are determined by PeopleTools heuristics. |
|
Application Server Summary |
Displays a summary of all participating application server domains. You can scroll the area to see the details, such as:
Note: If the system CPU usage is consistently high, add more hosts to share the workload. |
|
Process Scheduler Summary |
Displays a summary of all participating Process Scheduler domains. You can scroll the area to see the details, such as:
|