JVM Heap
This section of the dashboard provides heap information.
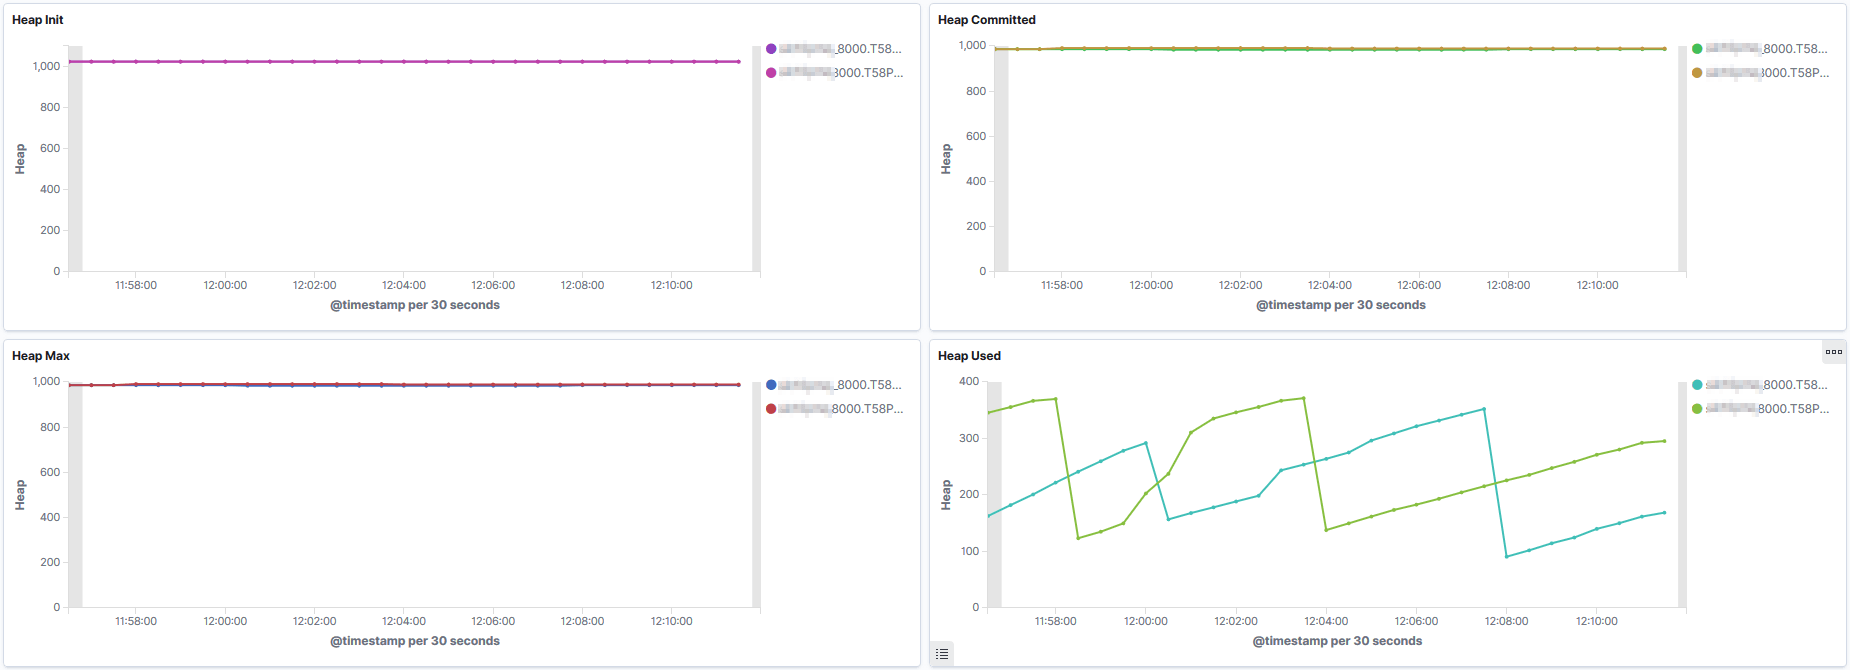
This example illustrates the fields and controls on the JVM Heap section. You can find definitions for the fields and controls later on this page.
| Field or Control | Description |
|---|---|
|
Heap Init |
A graphical visualization of the amount of memory (in MB) allocated for the heap when JVM started. |
|
Heap Committed |
A graphical visualization of memory (in MB) currently allocated for the heap. |
|
Heap Max |
A graphical visualization of the maximum amount of memory (in MB) allocated for the heap. |
|
Heap Used |
A graphical visualization of the amount of heap memory (in MB) currently in use by JVM. Note: If the JVM heap usage is very high or the number of rejected requests is high, there may be too much traffic directed to the Web server instance. To resolve, add more Web servers either on the same host, if the host can handle more load, or on a different host that can accommodate the load. |