Web Server Thread Details
The Web Server Thread Details section of the dashboard provides details and visualizations of the Web servers pool of executed threads.
This example illustrates the fields and controls on the Thread Details section. You can find definitions for the fields and controls later on this page.
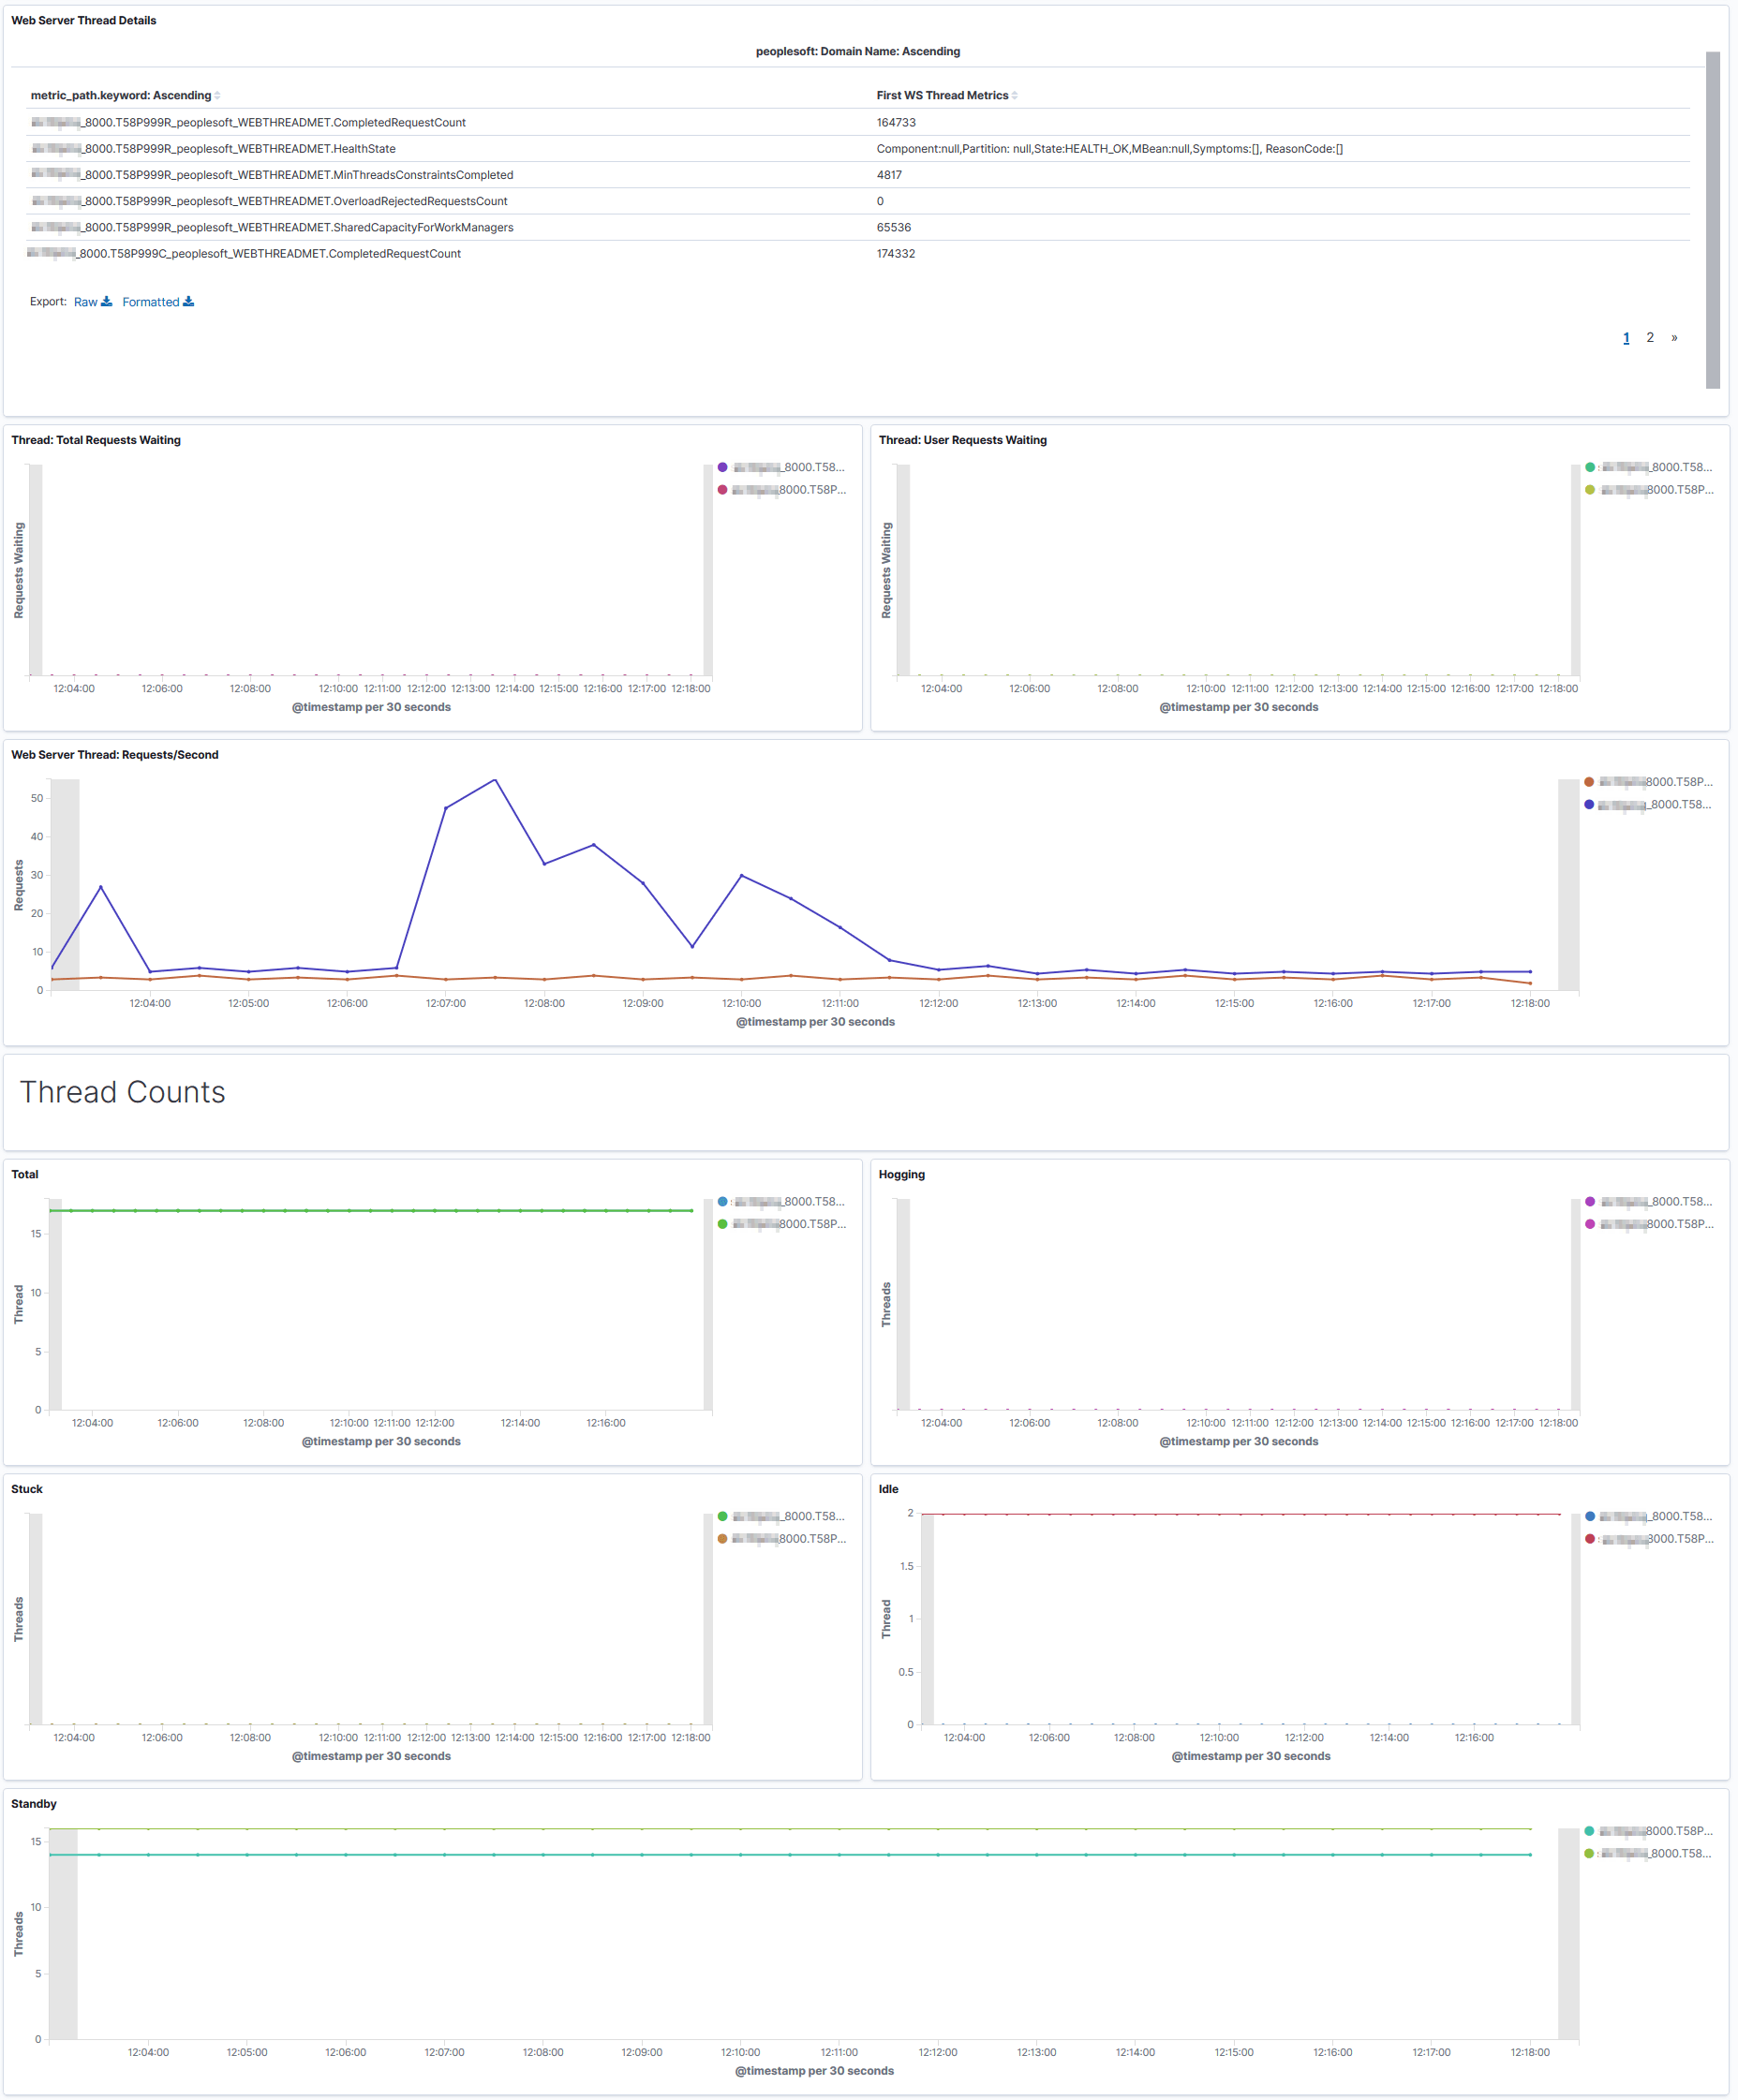
| Field or Control | Description |
|---|---|
|
Completed Request Count |
The number of completed requests in the priority queue. |
|
Health State |
In WebLogic, the thread pool is a subsystem that maintains its own health status indicator, so the status is sourced from WebLogic Mbeans. |
|
Minimum Threads Constraints Completed |
The number of requests with minimum threads constraint picked up out of order for immediate execution because their minimum threads requirement was not met. |
|
Overload Rejected Requests Count |
The number of requests rejected when no more requests can be accepted because the maximum shared capacity of work managers is utilized. |
|
Shared Capacity for Work Managers |
The maximum number of requests that can be accepted in the priority queue. |
|
Total Requests Waiting |
A graphical visualization of the number of pending requests in the priority queue. This is the total of internal system requests and user requests. |
|
User Requests Waiting |
A graphical visualization of the number of pending user requests in the priority queue. The priority queue contains requests from internal subsystems and users. This value is the count of all user requests. |
|
Requests/Second |
A graphical visualization of the mean number of requests completed per second. |
|
Thread Counts |
A graphical visualization of the number of threads in different states:
|
The following table lists the symptoms and causes for threads to be in stuck or hogging state, and their possible resolutions:
| Symptom | Cause | Resolution |
|---|---|---|
|
The threads involve PIA processing and the threads are stuck in Jolt calls in successive thread-dumps. |
The application server is taking too long to process the requests. |
Investigate the performance of those requests on the application server. |
|
The threads are stuck in outbound HTTP requests. |
The HTTP requests is taking too long to process or, in some case, it is due to incorrect network configuration. |
Investigate whether the response is slow due to internal traffic congestion or requests are taking too long to complete on the server. |
|
The thread (either a Web server thread or PIA-related thread) has high CPU usage. |
Check if the server is overwhelmed with too many requests. If so, add more servers. If high CPU usage continues, observe if specific requests cause the high CPU usage. Periodic thread-dumps may help get insight into what processing is taking more CPU time. |
Check Oracle support knowledge base if there is any known case of high CPU usage for the particular release of application being used. If the issue cannot be resolved, contact Oracle Support for assistance. |