Log Data Visualization with OpenSearch Dashboards
Use the Log Analyzer Dashboards to visualize, monitor, and analyze PeopleSoft log data across Application Server, Process Scheduler, and PIA environments. The dashboards provide centralized access to log metrics, user activity insights, transaction and process-based log correlation, and custom visualizations for efficient troubleshooting and performance analysis.
Access the Log Analyzer Dashboards by navigating to PeopleTools > Health Center > Log Analyzer Manager > Log Analyzer Visualizations.
This example illustrates the OpenSearch Dashboard where log data is visualized.
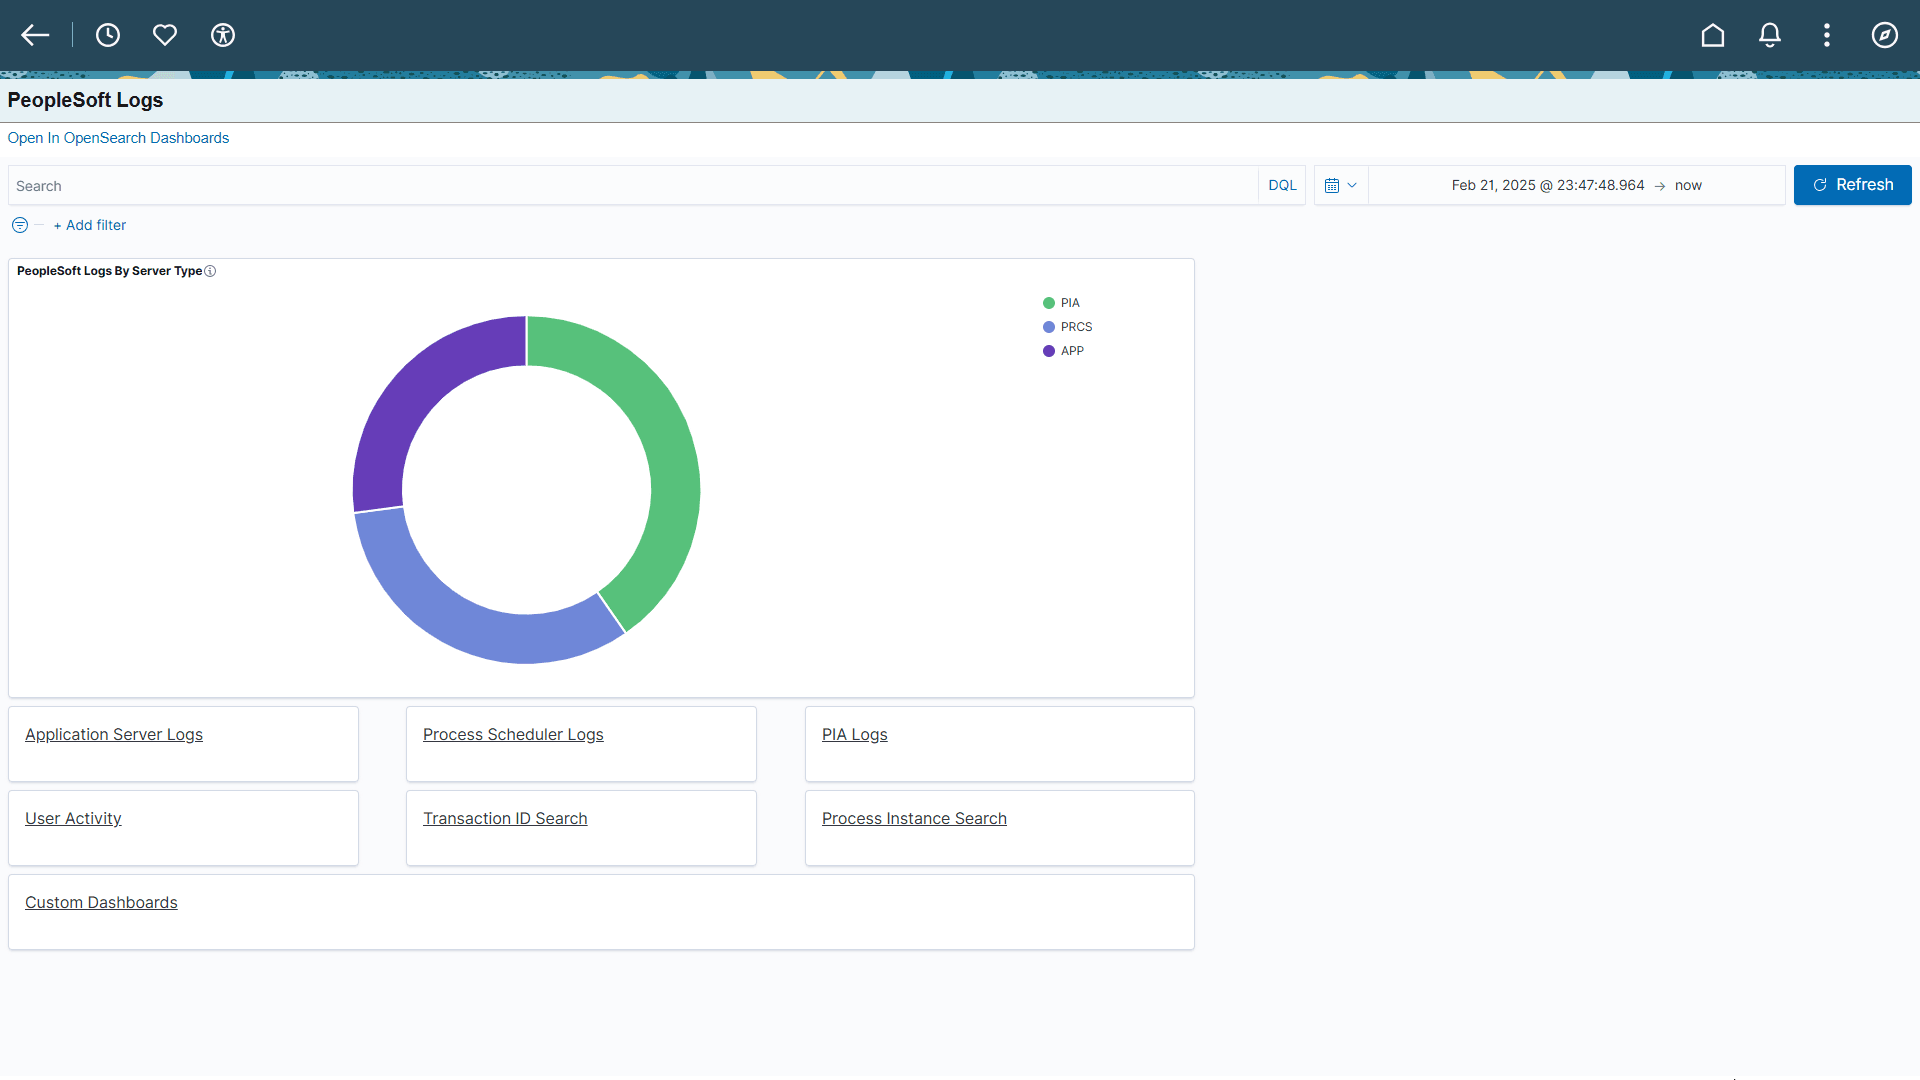
You can perform the following activities on the PeopleSoft Logs page:
- View App Server logs
- View Process Scheduler logs
- View PIA logs
- Monitor user activity: This dashboard presents a comprehensive overview of user activity derived from PIA Access logs.
It includes the following visualizations and metrics:
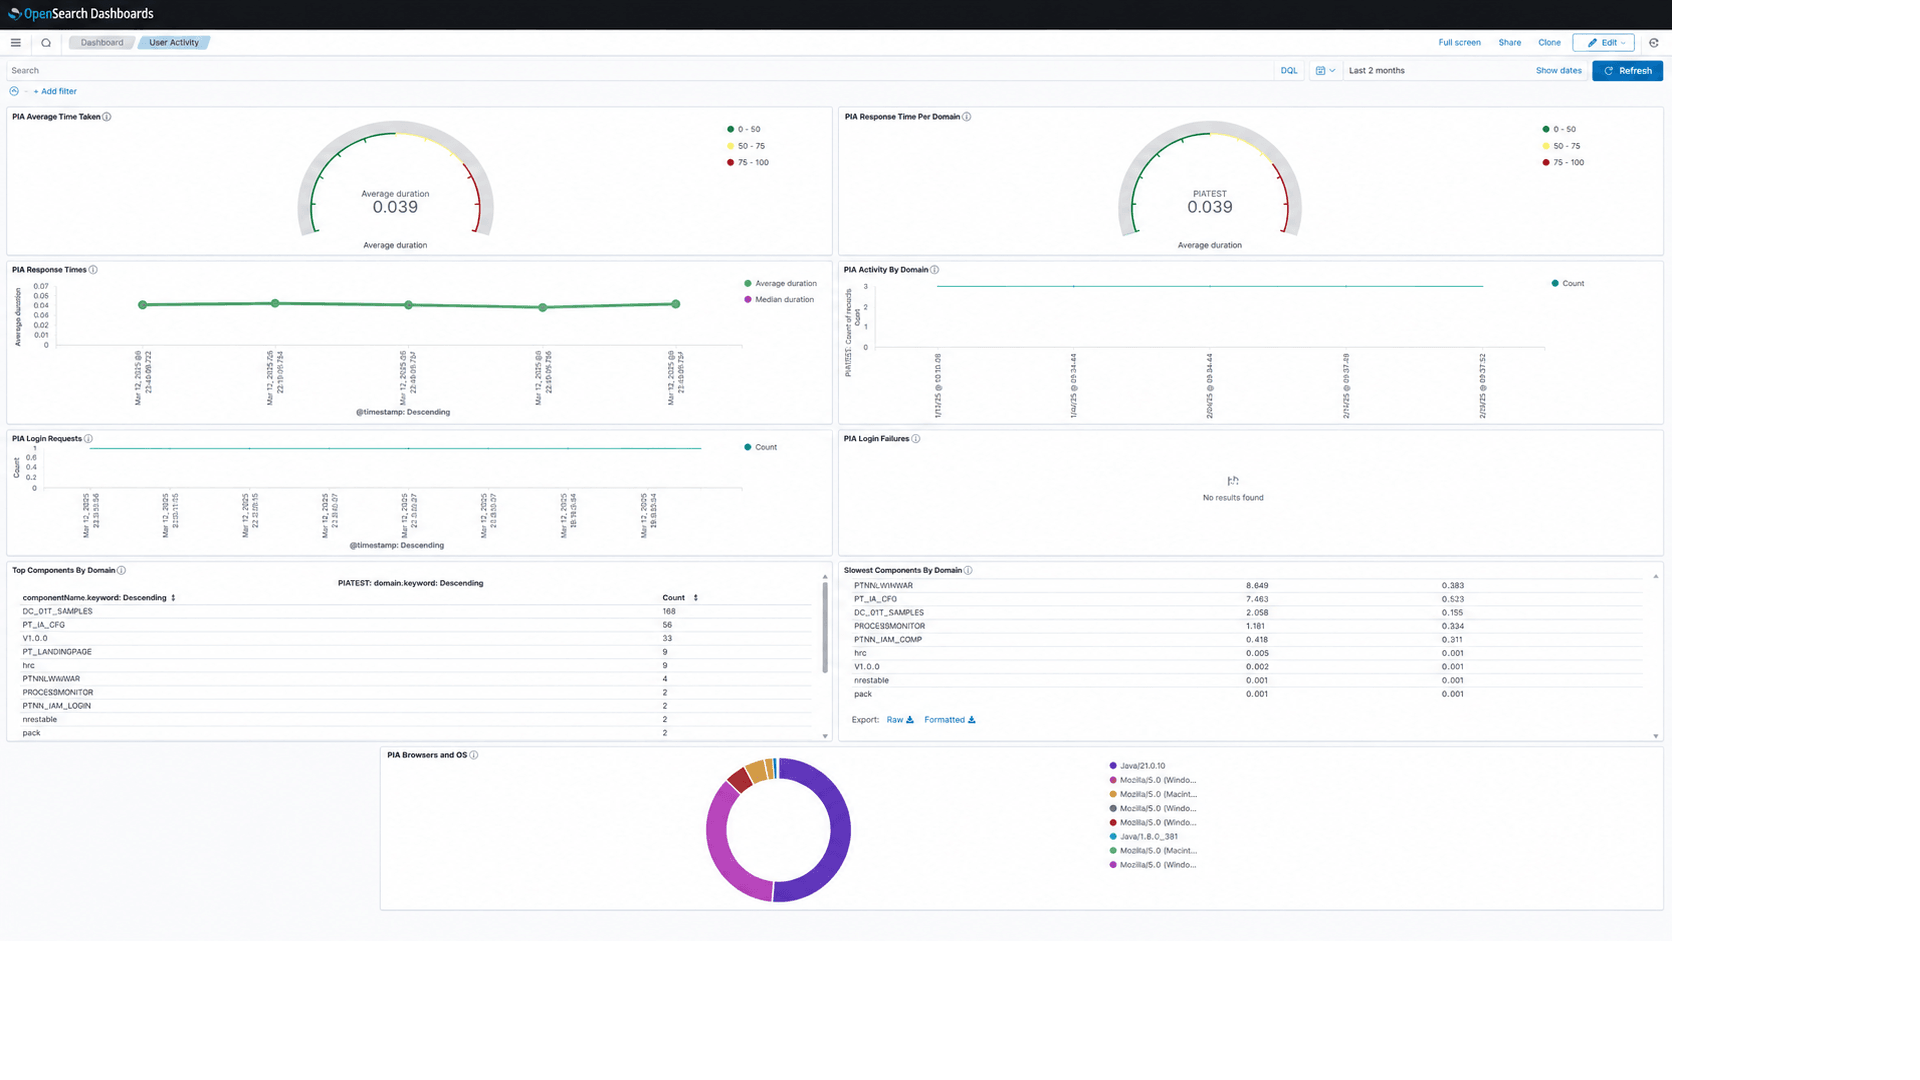
- Average Time Taken: Displays the average duration for all PIA requests
- Response Times Per Domain: Shows the average time taken to execute PIA requests for each domain
- Response Times (Line Graph): Illustrates average and median durations of requests over time
- PRD Activity (Line Graph): Represents the count of PIA requests per domain over time
- PIA Login Requests (Bar Chart): Provides the count of PIA login requests over time
- PIA Login Failures (Bar Chart): Displays the count of failed PIA login requests over time
- Top Components per Domain: Lists the top ten most accessed components based on the number of logged requests
- Slowest Components per Domain: Lists the ten slowest components based on the maximum and median request duration
- PIA Browsers and OS (Pie Chart): Shows a breakdown of server and operating system information for PIA requests
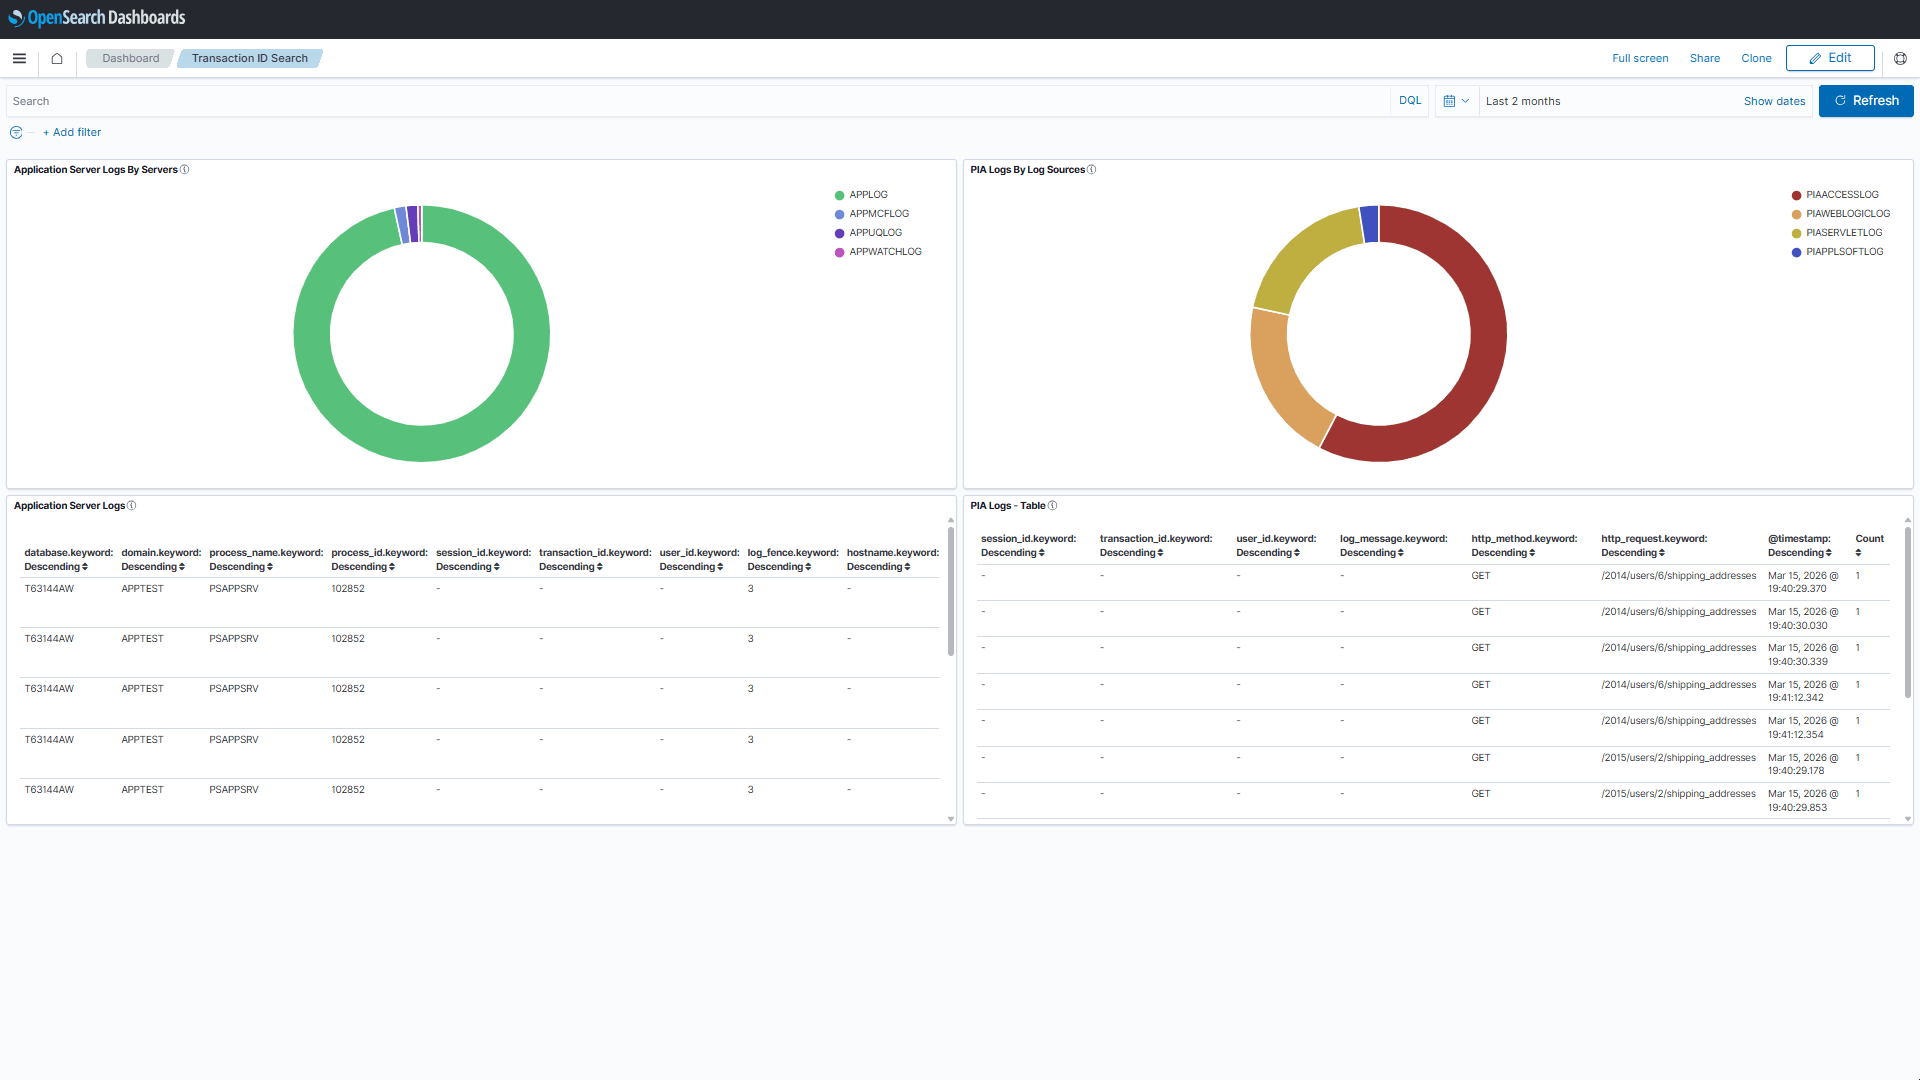
- Search data based on Transaction ID: This dashboard includes both Application Server logs and PIA logs. It provides correlation of transaction IDs across AppServer and PIA logs for unified analysis.
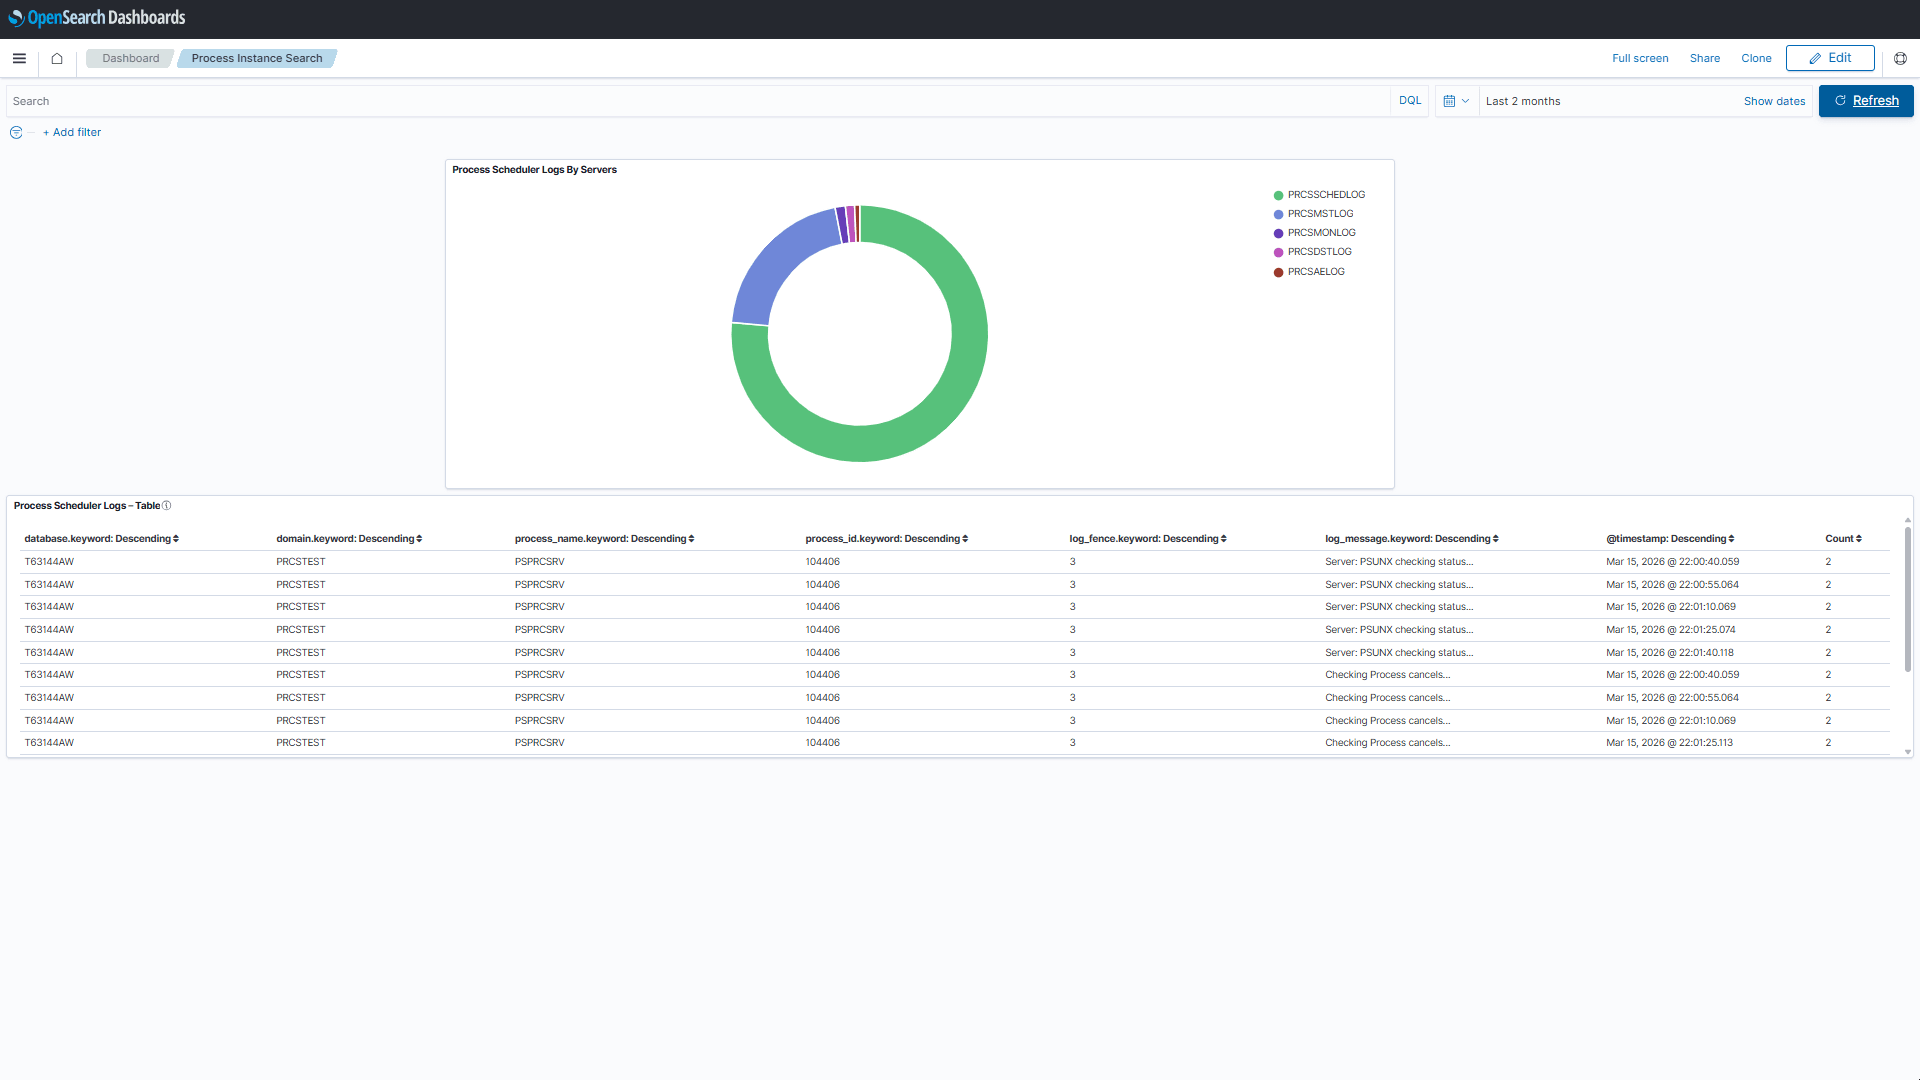
- Search data based on process instances: This dashboard contains all Process Scheduler Server logs. When you search by process instance, it provides a comprehensive view of the process instance’s activity across all relevant logs.
- Deploy custom dashboards: Use the Deploy Insights Dashboards page (navigation: PeopleTools > Search Framework > Administration > Deploy Insights Dashboards) to deploy or redeploy delivered and custom visualizations for Log Analyzer and to reset the status of the dashboards.
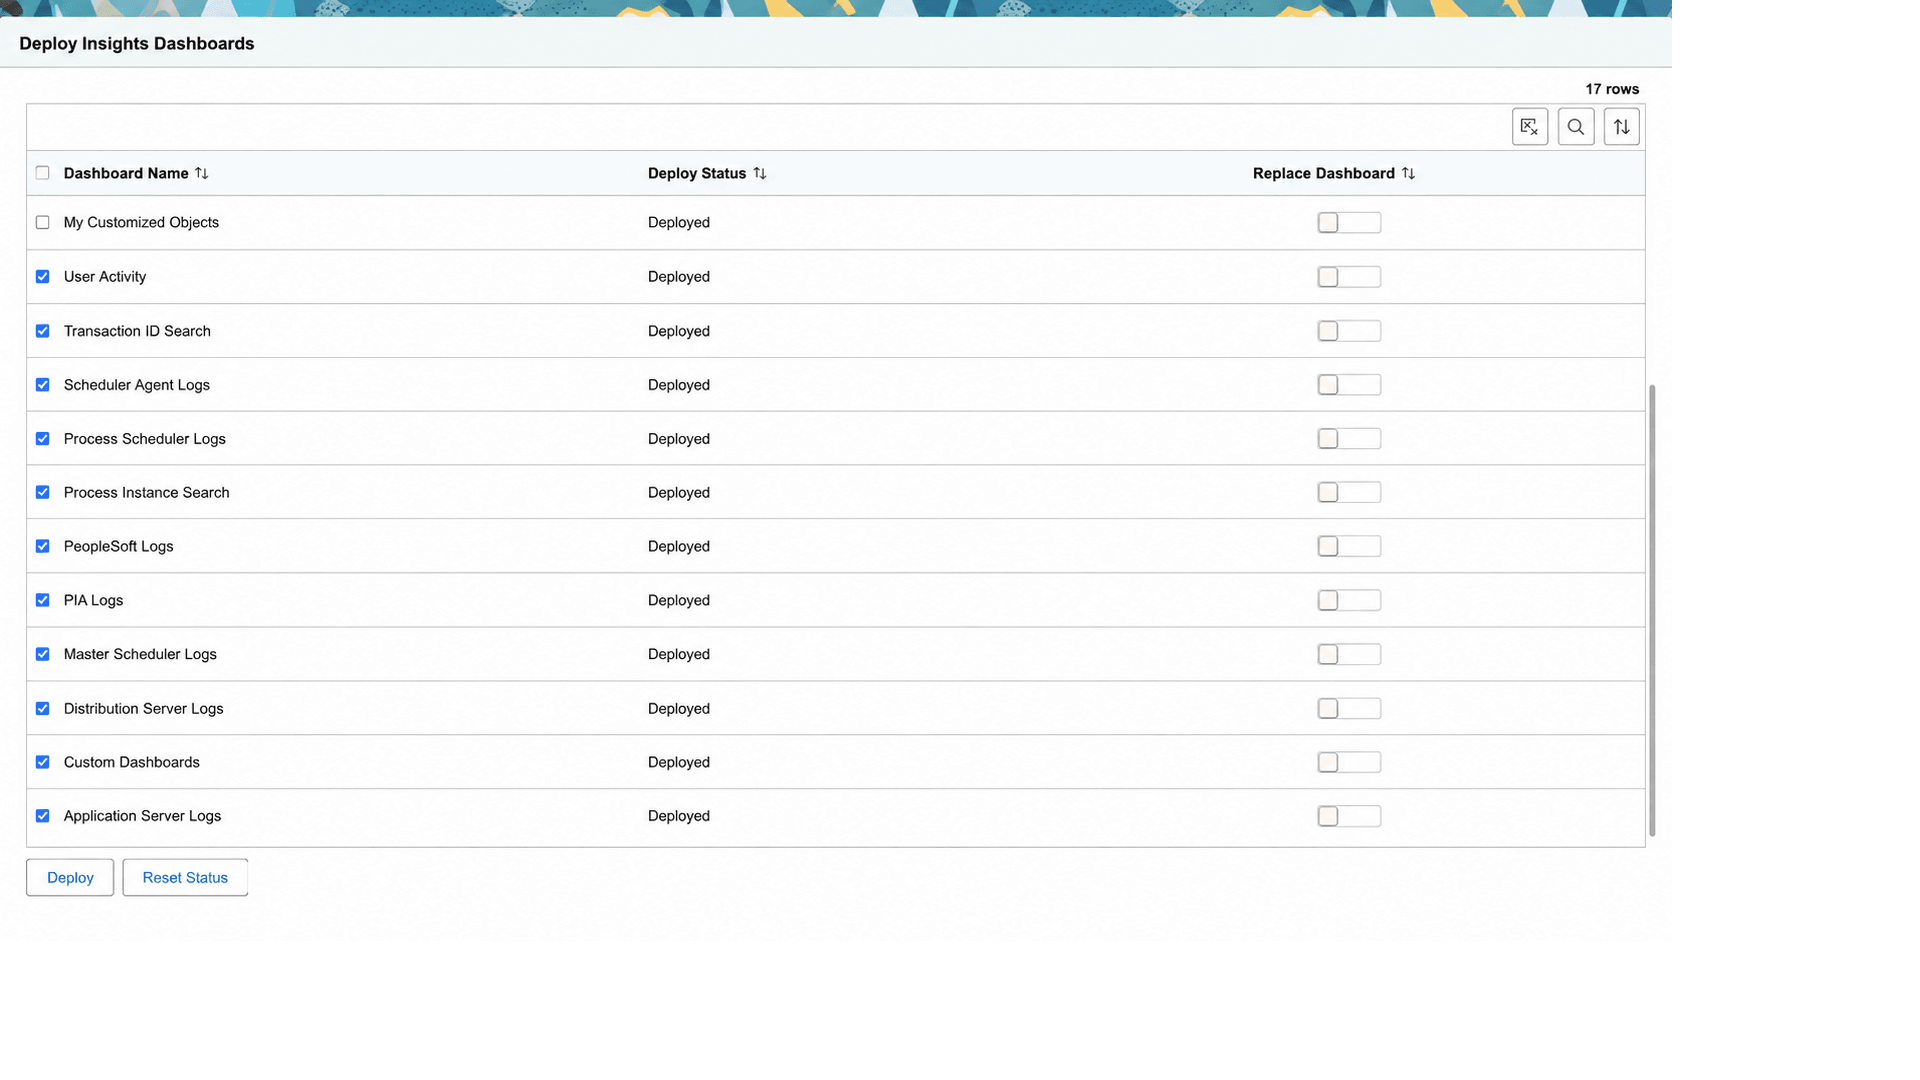
After deployment, you can access your custom dashboards by clicking the 'Custom Dashboards' link on the main Log Analyzer Dashboard.
Related Topics