The User Requests Chart
The User Requests chart reveals the time that a user initiated a specific request and its duration. The system displays user requests in sets of 10.
A single user request is represented by a bar within the bar chart. You can click any bar in the graph to view the associated User Request Detail component, which enables you to drill down into the details of a user request.
This example illustrates the fields and controls on the User Requests chart.
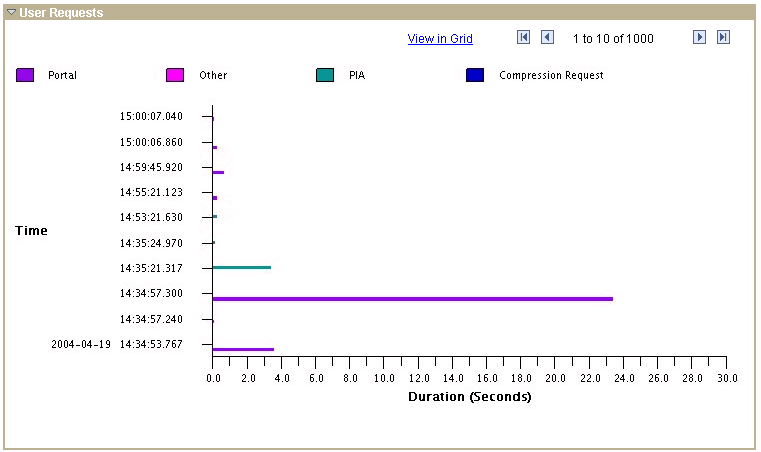
On this chart, the View in Grid hyperlink displays the chart information in a grid for downloading and customized sorting. The grid contains a hyperlink that accesses the User Request Details page.
The rows on the chart contain pop-up messages that appear when you move the cursor over the bar. The messages are:
-
For PMU 100 (Portal Request), the message reads Portal: [action] Duration (secs): yyy.
-
For PMU 101 (PIA Request), the message reads PIA: [action] Duration (secs): yyy.
-
For PMU 102 (Compression Request), the message reads Compression Request: [content type] Duration (secs): yyy.
-
All other PMUs show the PMU label followed by the duration.
See User Request Details.