Chart Options
Expand the Chart Options section to enter additional chart options.
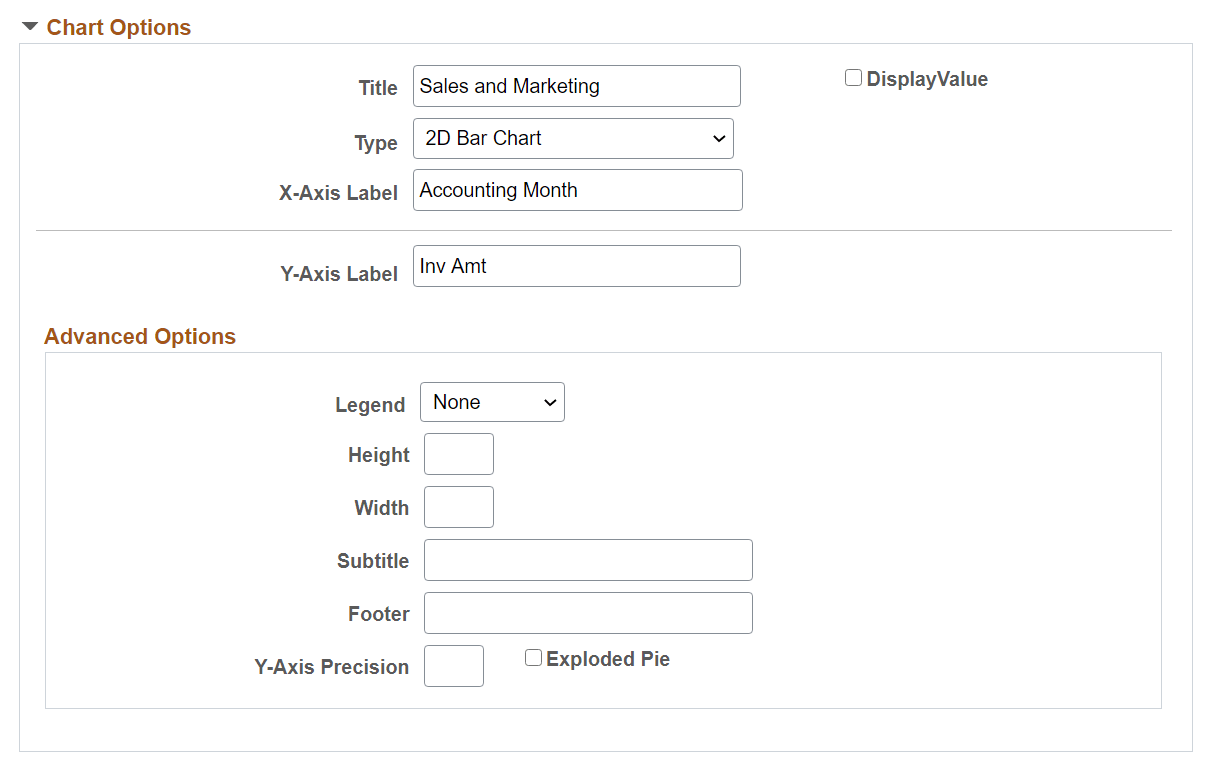
This example illustrates the fields and controls on the Specify Data Model Options page - Chart Options section. Definitions for the fields and controls appear following the example.
| Field or Control | Description |
|---|---|
|
Title |
Enter a title for your chart. By default, the Pivot Grid model name is used. |
|
Display Value |
Select this check box to display the data point values on the chart. The check box is disabled by default. |
|
Type |
All PeopleSoft chart types are available, including:
Note: 3-D charts are not supported as a chart type. |
|
X-Axis Label |
Enter a label for the X axis. By default, the field name for the X axis is used. |
|
Y-Axis Label |
Enter a label for the Y axis. By default, the field name for the Y axis is used. |
|
Advanced Options |
Define display options for the chart, including chart legend, and height and width of the chart. |
|
Legend |
Select a legend for the chart. The available options are Bottom, Left, None, Right, and Left. By default, the None option is selected. |
|
Y-Axis Precision |
Enter the number of decimal places in the Y-axis values. For example, when the Y-Axis Precision has a value of 2, the Y-axis in the chart has two decimal values. Note: When the pivot grid display is a pie chart type, then the Y-Axis Precision is disabled and considered as 0. |
|
Exploded Pie |
Select to view the 2D or 3D charts with exploded sectors. |
Related Topics