Grid-Display Component
The Pivot Grid Grid-display component is based on the existing PeopleSoft analytic grid. This component enables users to leverage the different functionality of the analytic grid, like multi-level display and the drag-and-drop operation. However, unlike the analytic grid, the grid in a Pivot Grid does not require the analytic server to run; it can function as a standalone Pure Internet Architecture component. As with the analytic grid, the grid in a Pivot Grid has three axes—row, column, and filter. You can place the axis and value members on any of these axes to provide different views of the same data.
The Grid-display component provides the following functionality:
-
Uses the Pivot Grid Data Source Engine interfaces to execute the data source at runtime to render data in a grid. The grid does not cache any data. Any layout modification will result in a new data source execution to retrieve the data.
Note:
Modifications in data sources are not saved; Pivot Grid executes data sources in an ad hoc way to retrieve information.
-
Responses to users' filtering, pivoting, and drill-down actions from within the grid. Each of these actions will result in the data source being modified and rerun to retrieve the rowsets again.
-
Exports the current slice of data visible in the grid to Microsoft Excel.
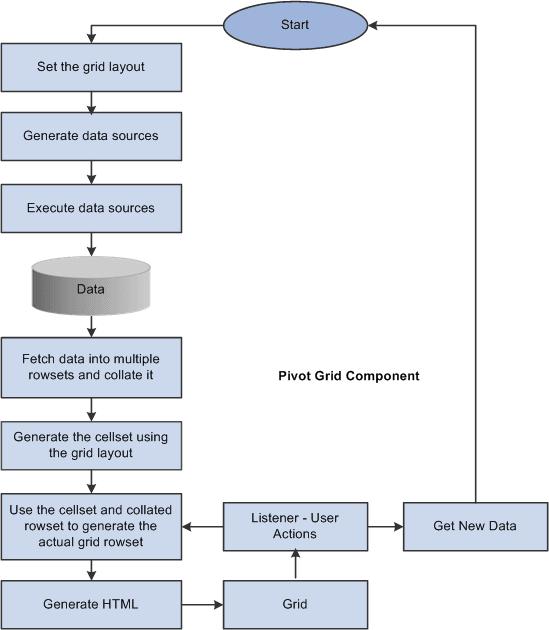
This diagram illustrates the process flow of the Grid-display component.
Note:
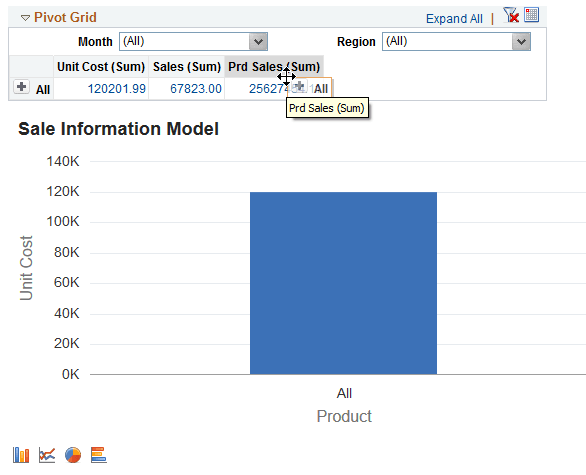
While you are dragging and dropping values, a move icon with a visible label indicates axis and values that can be dragged, and the droppable locations are indicated with a grey background for labels.
This example illustrates the axis value that is labeled Product and the drop zone that is labeled Unit Cost (Sum).