Moving Dimensions in the Grid
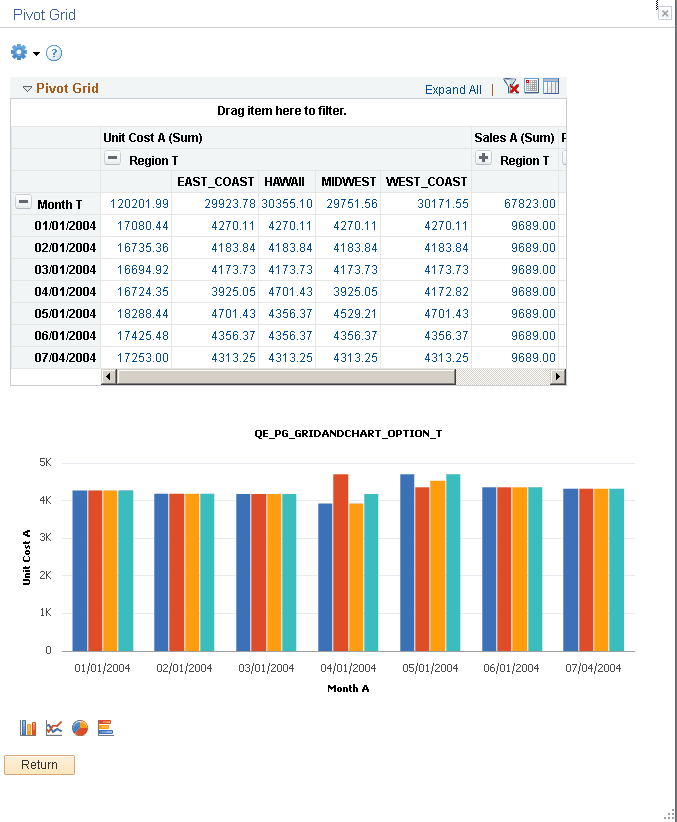
You can move a row to a column and other way round too. Chart will also reflect changes made to the grid.
In this example, the Region axis is dragged to the column axis.
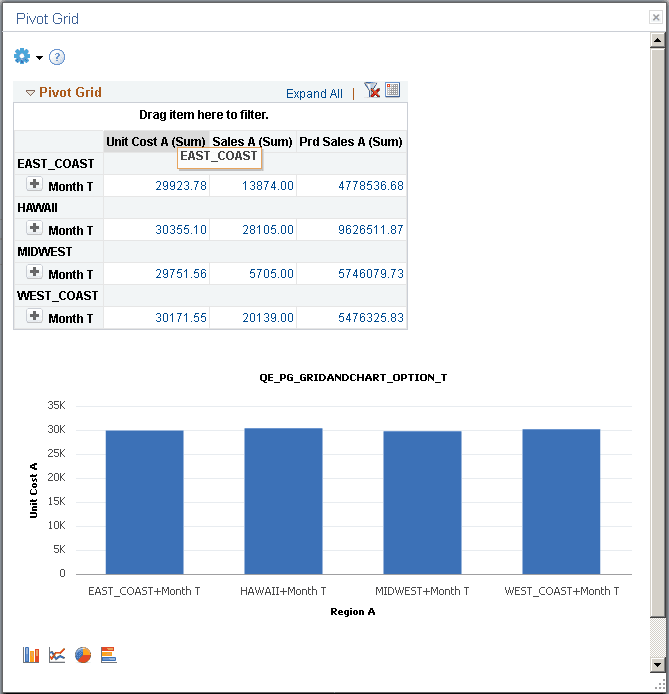
The chart and grid changes and shows data according to the changed axis.