Changing the Level of Dimensions
In this example, Month is changed to the highest dimension level by dragging the month up on the X axis.
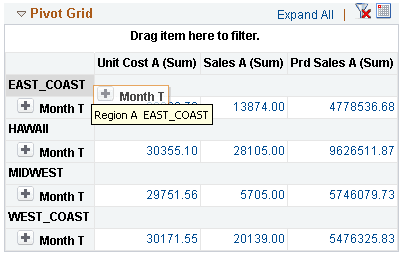
This example shows a portion of the grid after changing the dimension level.
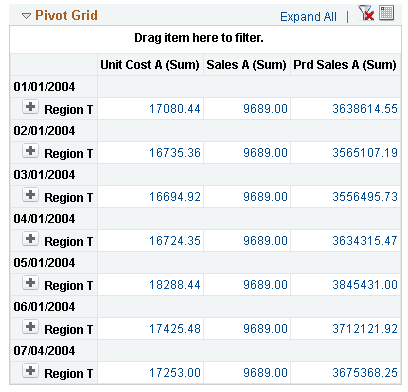
Chart also shows similar changes when there is any modification made to the grid.