Moving the Report Filter to the Axis
Drag the filter and move it to row or column.
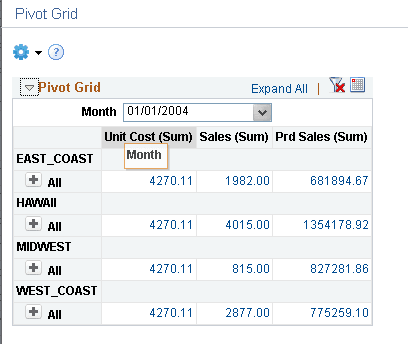
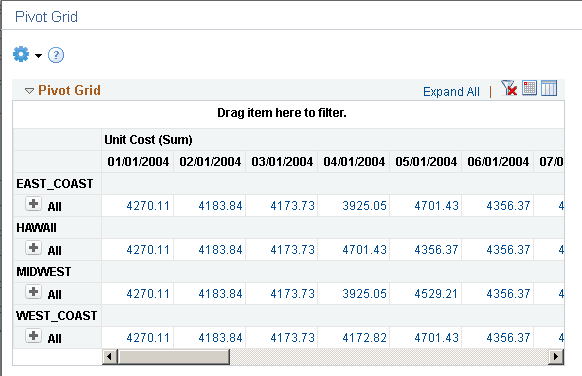
This example shows the report filter moved to the column axis.
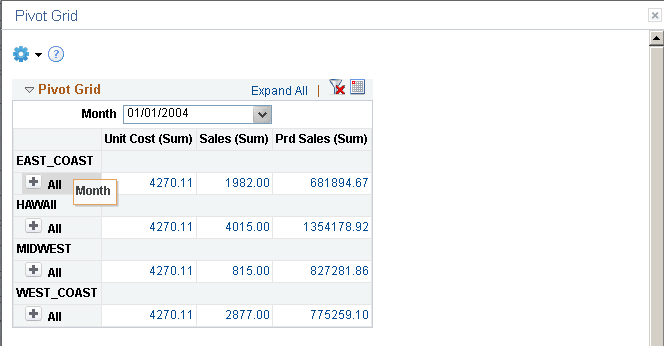
This example shows how to move the Month filter to a row axis by clicking the Month field and dragging it to the X axis.
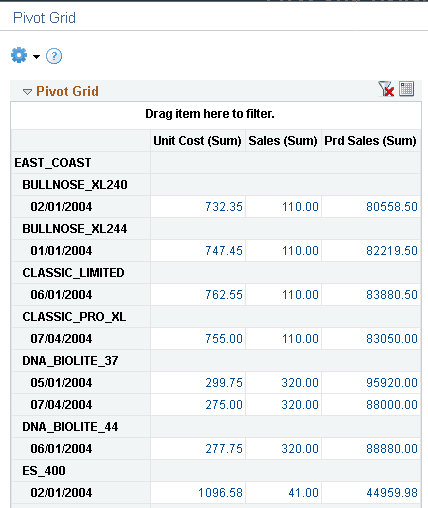
This example shows a portion of the grid view when the report filter is moved to the row axis.
When there is any change in the pivot grid, the corresponding chart also shows the change.