Understanding Filters
A filter is a dropdown list that enables you to select multiple items to filter data, which appears in grids and charts. You can select one or more Data Source Columns as a filter.
Filters on grid and chart are seen in the PeopleSoft Classic View. In fluid view facets behave like filters. You have to configure a filter to display a facet. See Creating Editable Facets.
You can change the grid layout at runtime by dragging axes onto the filter area to create them as filters; the chart layout also changes based on the grid layout to preserve synchronization between the grid and the chart.
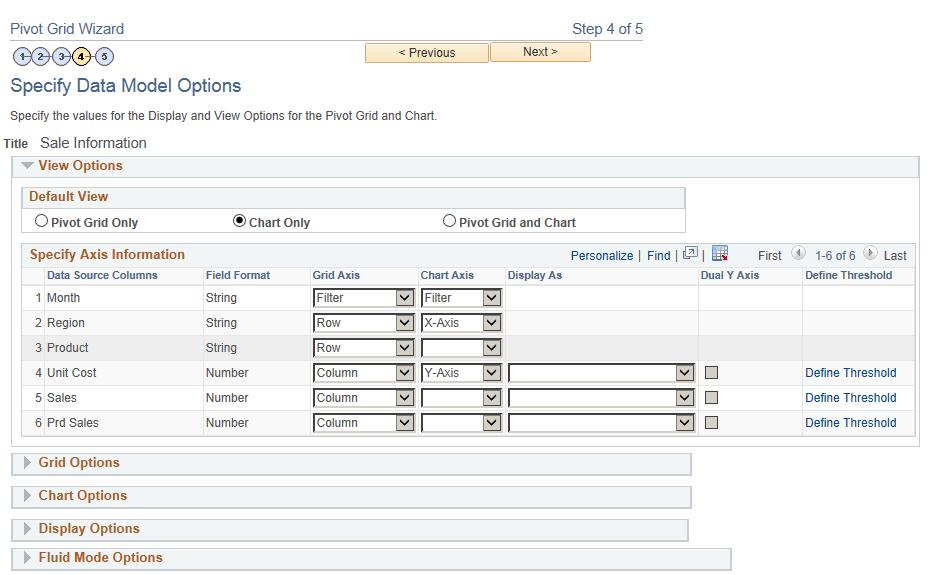
Chart Axis or Grid Axis can be assigned a filter for any Data Source Column. The Data Source Column should be defined as a Axis in the Specify Data Model Values page in the Pivot Grid Wizard.
In this Specify Data Model Options page, Month is defined as a filter.
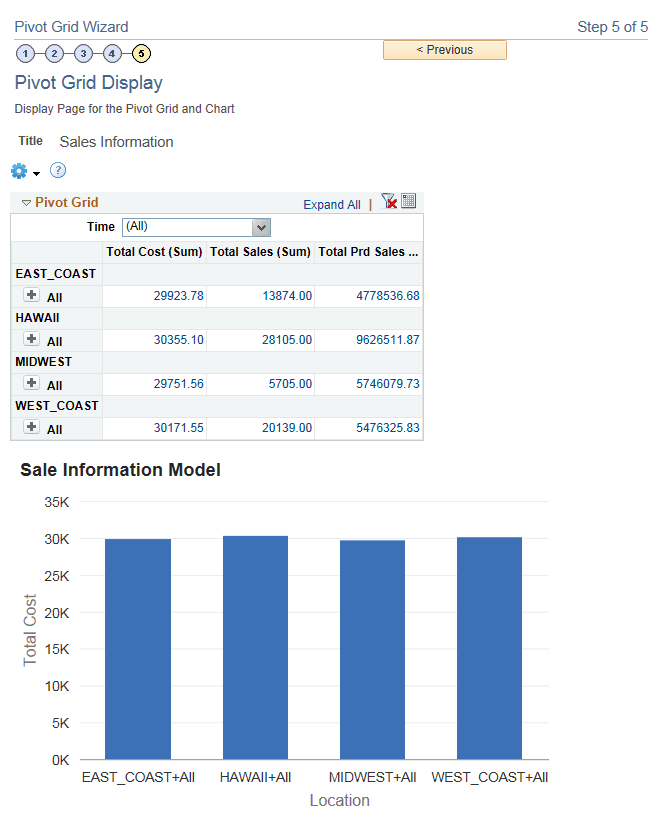
This example shows the view of a Pivot Grid model when the display option is Pivot Grid and Chart and the filter is set to Month (Time). In the example Time is the Column Label assigned to the Data Source Column Month.