Using the User Charting Options in Pivot Grid Wizard
To access the User Charting Options dialog box, go to Step 5 of the Pivot Grid Wizard, select the gear icon (Options Menu), and then select Chart Options.
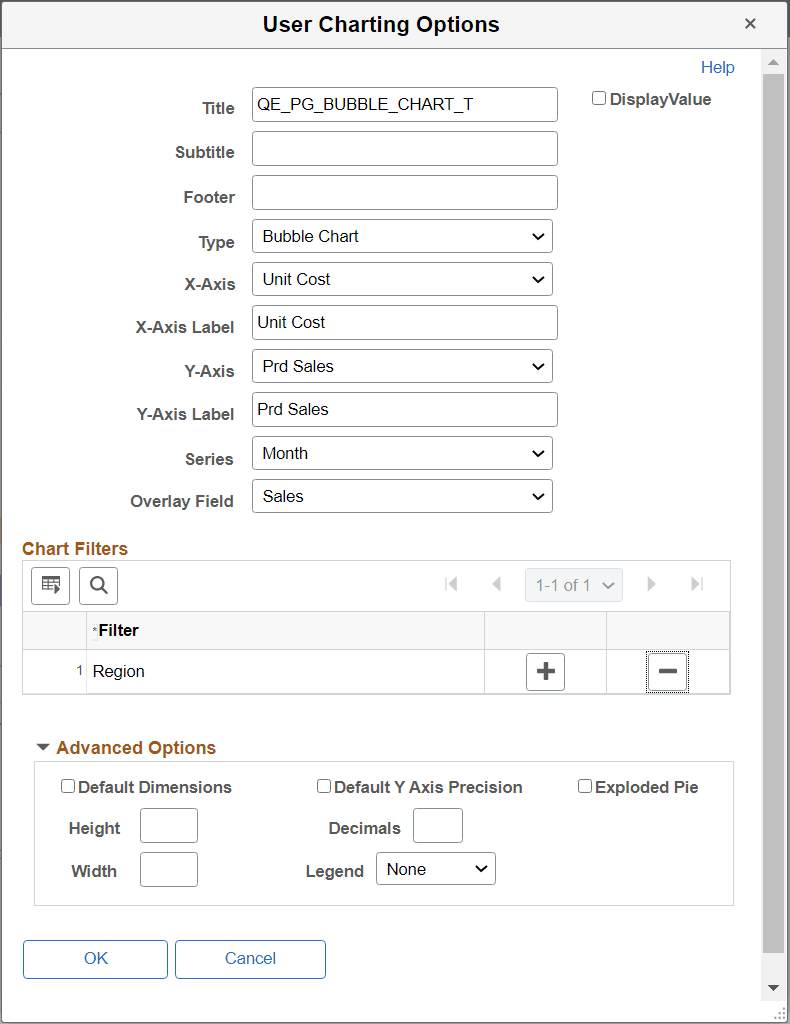
This example illustrates the fields and controls in the User Charting Options dialog box.
Note:
The X Axis, Y-Axis Series, Overlay Field, and Chart Filters fields in the User Charting Options dialog box are not editable if the display option is Pivot Grid and Chart.
| Field or Control | Description |
|---|---|
|
Title |
Enter the title of the pivot grid. |
|
Display Value |
Select this check box to display the data point values on the chart. The check box is disabled by default. |
|
Subtitle |
Enter the subtitle if required. It displays under the title with smaller font size. |
|
Footer |
Enter additional information to display as footer text. |
|
Type |
Select the display type of the chart . See Chart Options. Note: 3-D charts are not supported as a chart type. |
|
X-Axis |
Select to change the X-Axis. You can change the X-axis from the User Charting Options, if you decide to use another field as x-axis. |
|
X-Axis Label |
Enter or modify the X-Axis label. |
|
Y-Axis |
Select to change the Y-Axis. You can change the X-axis from the User Charting Options, if you decide to use another field as y-axis. |
|
Y-Axis Label |
Enter or modify the Y-Axis label. |
|
Series |
Select the x-axis field to define as series. |
|
Overlay Field |
Select the Y-axis field to define as an overlay. |
|
Chart Filters |
Add or delete filters displayed on the chart view. |
|
Advanced Options |
Define display options for the chart, including chart legend, and height and width of the chart. |