Specifying Chart Display Options
After selecting the Chart option on the Select Display Format page, select the Specify Display Options page. (Select On the Select Display Format page, click the Next button.)
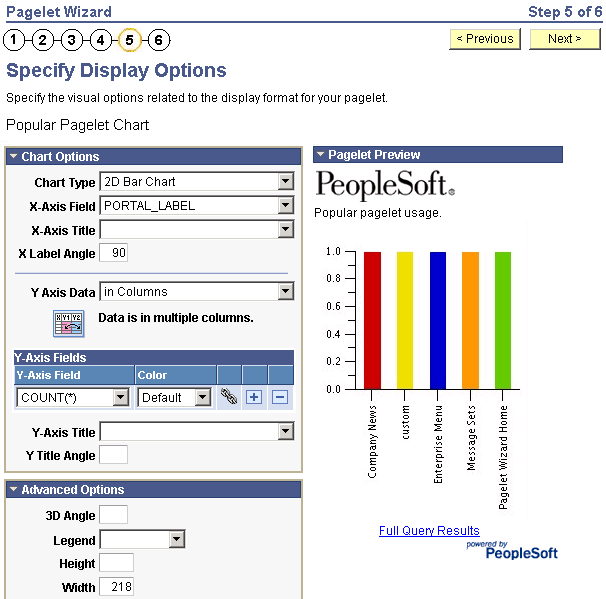
This example illustrates a portion of the fields and controls on the Specify Display Options page for the chart display format. You can find definitions for the fields and controls later on this page.
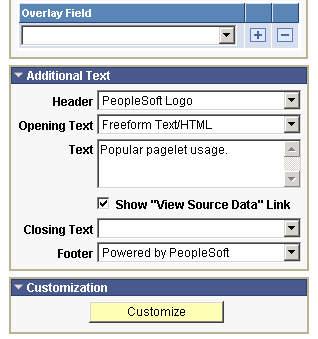
This example illustrates the remainder of the fields and controls on the Specify Display Options page for the chart display format. You can find definitions for the fields and controls later on this page
To generate a chart pagelet using Pagelet Wizard, you include information related to the chart’s x and y axes. The y axis is the axis that contains the query data. In most charts, the y axis is the vertical axis. However, in a horizontal bar chart, the y axis is the horizontal axis. The x axis is the axis against which the y-axis data is measured.
For example, a chart pagelet might have a y axis that displays the number of times that a pagelet has been accessed. This access count could be displayed against an x axis that shows the name of the pagelet accessed.
Chart Options
| Field or Control | Description |
|---|---|
|
Chart Type |
Select the type of chart to use to display the query results on the pagelet. Available chart formats are those supported by the PeopleCode Chart class. See PeopleCode API Reference: Understanding the Charting Classes. |
|
X-Axis Field |
Select the field to use to derive x-axis values for the chart. Available values are determined by the output fields of the data source. |
|
X-Axis Label |
Select the field that you want to use to derive the labels for the x-axis values for the chart. Available values are determined by the output fields of the data source. |
|
X Label Angle |
Enter the angle at which you want the text of the x-axis labels to appear along the x axis on the pagelet. |
|
Y Axis Data |
Select to indicate whether the y-axis data is stored in rows or columns in the selected query. This enables Pagelet Wizard to read query data and generate the chart. in Columns: Select if the y-axis data is stored in columns. |
In this example, the query data is stored in columns (labeled Revenue and Profit) as shown here:
| Quarter | Revenue | Profit |
|---|---|---|
|
Q1 |
3562 |
1010 |
|
Q2 |
3473 |
1290 |
|
Q3 |
4568 |
1490 |
|
Q4 |
5668 |
2769 |
| Field or Control | Description |
|---|---|
|
Y Axis Data (continued) |
in Rows: Select if the y-axis data to be used to generate the chart is stored in rows. |
In this example, the same data is stored in rows with Revenue and Profit stored as data values in the Type column as shown here:
| Quarter | Type | Value |
|---|---|---|
|
Q1 |
Revenue |
3562 |
|
Q1 |
Profit |
1010 |
|
Q2 |
Revenue |
3473 |
|
Q2 |
Profit |
1290 |
|
Q3 |
Revenue |
4568 |
|
Q3 |
Profit |
1490 |
|
Q4 |
Revenue |
5668 |
|
Q4 |
Profit |
2769 |
| Field or Control | Description |
|---|---|
|
Y-Axis Field |
Select the field that you want to use to derive y-axis values for the chart. Available values are determined by the output fields of the data source. If you set the Y Axis Data field to in Columns, you can select up to four y-axis fields to create a chart pagelet that displays data for multiple fields. For example, if you track sales figures for several departments over multiple years, you can assign each department its own y-axis value. |
|
Color |
Select the color for the y-axis data. If you select multiple y-axis fields, selecting a different color for each field improves pagelet usability. This option is available only if the y-axis data is in stored columns. |
|
Y-Axis Series |
This field is available if the Y Axis Data field is set to Rows. Select the field to use to generate a color-coded series of y-axis data. Colors are automatically assigned, but you can override them by supplying custom XSL. |
Advanced Options
| Field or Control | Description |
|---|---|
|
3D Angle |
If you select a 3D chart type, enter the angle at which you want the 3D data to be displayed. |
|
Legend |
Select the area of the pagelet for the chart legend to appear. Options are:
|
|
Height |
Enter the height of the chart in pixels. |
|
Width |
Enter the width of the chart in pixels. If you do not enter height or width values, the chart is automatically sized based on the pagelet position and size (narrow or wide). |
|
Overlay Fields |
Select up to three fields for which you want to display data using a line drawn over the background chart. Overlays apply to all chart types except 2D and 3D pie charts. |
Pagelet Preview
Displays a preview of the pagelet based on most display option settings on this page.