Monitoring the Status of Reports
When a report fails to post to the Report Repository or fails to send the message to have the report added on the Report Manager - Explorer or Report Manager - List page, check the following sources to trace the problem:
-
The distribution status on the Report Manager - Administration page and the Process Monitor - Process List page.
-
The message log on the Report Manager - Report Detail page.
-
The run status on the Process Monitor - Process List page.
-
The Service Operations Monitor in PeopleSoft Integration Broker.
-
The Distribution Agent log files.
See Integration Broker: Introduction to PeopleSoft Integration Broker.
Distribution Status on the Report Manager - Administration Page
The Report Manager - Administration page displays the current state of a report. The distribution status of the report shows the process of a request without having to check the Process Monitor. The following table lists the available statuses:
| Status | Description |
|---|---|
|
N/A or None |
The process has just been added to the report request, but processing has not yet started. No file is available to post. An error has occurred and no file is available to post. |
|
Generated ( SQR only) |
The report has finished processing and all files are available for transferring. |
|
Posting |
The report is in the process of being transferred to the Report Repository. |
|
Posted |
The report was successfully transferred to the Report Repository. |
|
Not Posted |
The Distribution Agent was unsuccessful in transferring the files from the PeopleSoft Process Scheduler server into the Report Repository. |
Message Log on the Report Manager Detail page
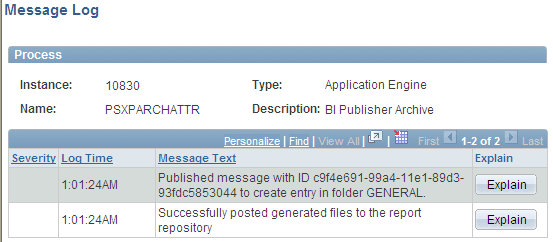
When the Distribution Agent receives the request to post the report, the agent inserts information into the Message Log table, detailing any important event. This information can be helpful in tracking down problems that the Distribution Agent encountered. If HTTP is used to transfer reports to the Report Repository, the message log includes error messages that are received from the Java servlet (SchedulerTransfer). This example illustrates a message log entry.
This example illustrates the fields and controls on the Example message log entry.
Run Status on the Process Monitor Detail Page
The Process Monitor − Process Detail page in PeopleSoft Process Scheduler displays the run status of a scheduled request. As PeopleSoft Process Scheduler processes the reports, it updates the status of the request. The following table shows:
-
The different stages that a process request with an output destination type of Web goes through from the time that the PeopleSoft Process Scheduler Server Agent initiates the process to the time that the Distribution Agent transfers the files to the Report Repository.
-
How the Report Manager distribution status changes as each stage is completed.
Note:
The table shows only process requests with an output destination type of Web. Other process requests can be tracked through the message log.
| Stage of Process Request | Distribution Status (Report Manager) |
|---|---|
|
A new process request is created. |
N/A or None |
|
The program for the process request is started. |
N/A |
|
The program has finished. |
N/A |
|
The Distribution Agent attempts to transfer the files to the Report Repository. |
Posting |
|
The Distribution Agent failed to transfer a file to the Report Repository and hasn’t reached the Maximum Transfer Retries value. Note: Maximum Transfer Retries value is the number that sets how many times the Distribution Agent should retry the report Repository file transfer when it fails. The message log for the process request is updated. |
Posting |
|
All files are successfully transferred to the Report Repository. |
Posted |
|
The Distribution Agent failed to transfer files to the Report Repository and has used up the maximum transfer retries. |
Not Posted |
Service Operations Monitor in PeopleSoft Integration Broker
Select to access the Asynchronous Details page.
Note:
You can also access this page by selecting the Details link for a specific transaction ID on the page.
This example illustrates the fields and controls on the Asynchronous Details page.
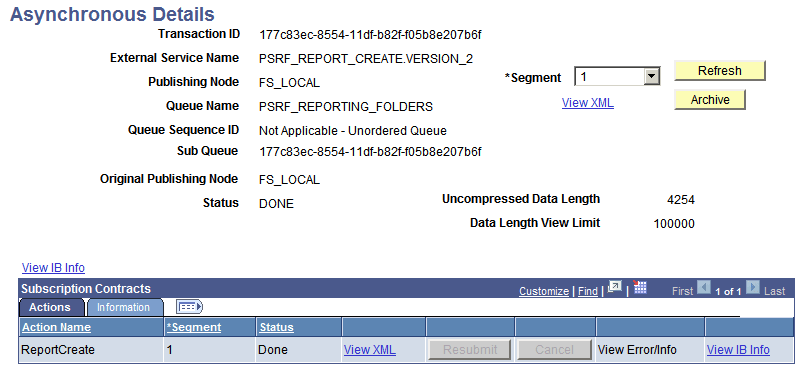
After the Distribution Agent posts the report to the Report Repository, the final task is to send a message to have the entry added to the report folder table. The Distribution Agent writes the transaction information, which includes the transaction ID and the report folder. The transaction ID can be used to monitor the status of the sent message in PeopleSoft Integration Broker.
See Integration Broker: Messaging Types, Integration Broker Service Operations Monitor: Understanding Asynchronous Service Operations Statuses.
Distribution Agent Log Files
Additional information can be found in the Distribution Agent log files.