Viewing Process Detail Actions
This section discusses the process detail action pages.
Note:
All action pages contain a group box that displays general information about the process.
Viewing Process Request Parameters
Access the Process Request Parameters page.
Use this page to view additional information about the process parameters.
All non-secure, runtime definition variables are expanded for both client and server requests in this group box. This information should help eliminate configuration problems by identifying incorrect entries in either the PeopleSoft Configuration Manager (PSADMIN) or the operating environment.
| Field or Control | Description |
|---|---|
|
Command Line |
Displays the path and program used to run the process. You can select the command line and copy it into other tools. This is useful when trying to isolate a request-related problem originating outside of PeopleSoft Process Scheduler, such as an incorrect entry in Configuration Manager or an SQR compile problem. For example, after copying the command line, you might paste the parameters directly into the target of an SQRW icon and then run the process outside of PeopleSoft Process Scheduler to isolate a problem. |
|
Working Dir (working directory) |
Displays the directory in which the database connectivity software is installed. |
|
Destination |
Displays the location of the completed output that is generated by the process, such as %%OutputDirectory%%. When the output destination for the process is Web, the destination lists the user or role IDs that are authorized to view the report in Report Manager. |
|
Message Text |
Displays additional information about the process status. Typically, this displays built-in messages that describe the status of the program that you are running. |
Note:
You must manually provide passwords (CP %OPPPSWD% params) that are required in the request parameters, because they are not exposed on the Process Request Parameters page for security reasons.
Viewing the Message Log
Access the Message Log page.
Use the Message Log page to view messages that are inserted into the message log by the program that are running.
| Field or Control | Description |
|---|---|
|
Explain |
Click to see a detailed explanation of the message. |
Note:
This option is available for PeopleSoft Application Engine and COBOL processes only.
Viewing Batch Timings
Click the Batch Timings link on the Process Detail page to access the Batch Timings report.
Note:
The Batch Timings link is only available for process requests with a process type of Application Engine.
The Batch Timings report contains a set of statistics that system administrators can use to tune the system to gain better performance. This report relates specifically to PeopleSoft Application Engine program performance.
Viewing Transfer Pages
Click the Transfer link on the Process Detail page to access the page defined on the Page Transfer page for this process definition.
Viewing Temporary Tables
Click the Temp Tables link on the Process Detail page to access the Temporary Tables page.
Temporary tables can be important assets for many PeopleSoft Application Engine programs. They are used to:
-
Store transient or intermediate results during a program run.
-
Improve performance.
Viewing Log and Trace Files
Click the View Log/Trace link on the Process Detail page to access the View Log/Trace page.
This example illustrates the fields and controls on the View Log/Trace page.
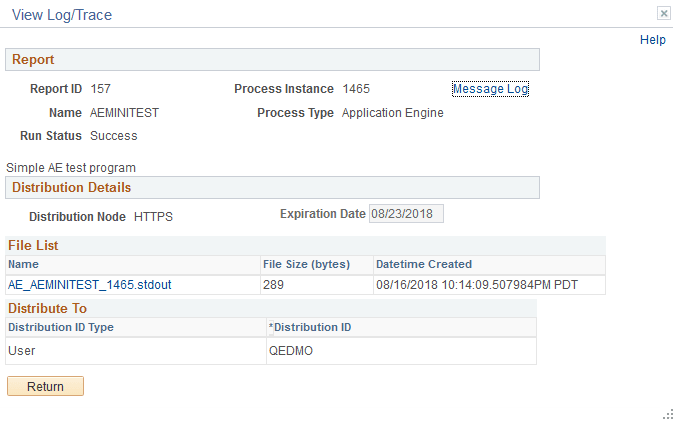
The View Log/Trace page enables you to view the output file, message log and trace file in a browser. The View Log/Trace link appears active on the Process Detail page when at least one of the following conditions is met:
-
The output destination for the process request is Web, and the report and log files were successfully posted to the Report Repository by the Distribution Agent.
The process must have a run status of Success.
-
If the report has not been transferred to the Report Repository, the run status of the process request remains Processing and the View Log/Trace link is not active.
-
If the status of the request remains Processing, check the message log for messages from the Distribution Agent indicating that problems occurred while transferring files to the Report Repository.
-
-
The process request ran from a PeopleSoft Process Scheduler Server Agent that was set up using the Server Definition page with a distribution node.
You must have also selected to transfer log files to the Report Repository when you set up the preferences on this page.