Managing Currently Running Queries
Use the Executing page (QRY_KILL) to cancel currently running queries, and enable or disable queries and logging.
Navigation:
This example illustrates the fields and controls on the Executing page.
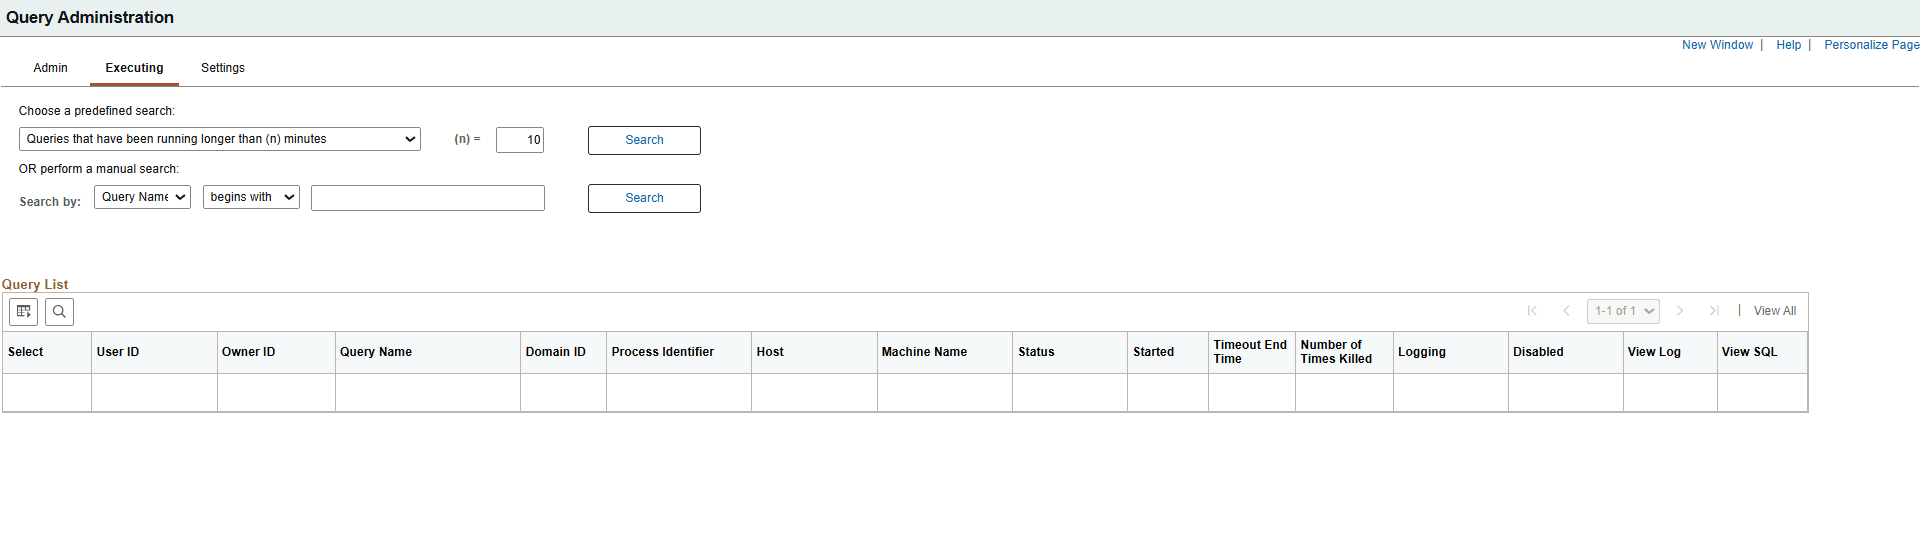
The Executing page displays all of the currently running queries, allowing you to enable or disable queries, enable or disable logging, and cancel currently running queries. If administrators needs to verify that a query has been canceled, they can look in the Appsrv.log and verify that the PSMONITORSRV service has canceled the selected query.
To manage currently running queries:
-
Use either the predefined search or manual search option to restrict the list of queries that are displayed.
For a predefined search, select one of the following options:
-
Queries that have been running longer than (n) minutes
-
Top (n) queries by longest run time
-
-
In the (n)= field, enter the value that you want for the search option.
For a manual search, select to search queries by query name or owner ID.
You can define your search further by selecting either the begins with or contains search type.
-
Click the Search button to display a list of queries that match your search criteria.
The Query List group box lists those queries that match your search criteria.
-
Review the following statistics for each query that is listed:
-
User ID
-
Owner ID
-
Query name
-
Domain ID
-
Process identifier
-
Host
-
Machine name
-
Status
-
Time started
-
Time-out end time
-
Number of times killed
-
Logging status
-
Disabled status
-
-
For the appropriate query, click the View Log link to view the log for that query.
A message appears if no logs are available.
-
For the appropriate query, click the View SQL link to view the SQL for that query.
-
Select the check box for each query on which you want to perform an action.
You can also click the Check All button to select all queries, or click the Uncheck All button to clear all queries.
-
Perform an action by clicking one of the following buttons:
-
Kill Selected Processes: Forces the selected query to stop running.
-
Logging On: Enables logging for the selected query.
When you enable logging, detailed statistics are logged on the query after every time it has run to completion. The statistics are stored in a separate Query Log table.
-
Logging Off: Disables logging for the selected query.
-
Enable: Enables the selected query to be run, previewed, or scheduled.
-
Disable: Disables the selected query from being run, previewed, or scheduled.
-
-
For the appropriate query, select the Logging check box to enable logging for that query.
Note:
Your changes are saved automatically and the Save button is not available.
The kill query (cancel query or time-out) mechanism represents each query that is run from Query Manager or Query Viewer as a row in the table PSQRYTRANS. Query Monitor, which implements the time-out functionality, has a mechanism that looks for orphan rows in PSQRYTRANS. Orphan rows are rows in PSQRYTRANS that do not have a query actively running. Orphan rows can be created because the server crashed while running a query, or for other reasons.
Query Monitor looks for orphan rows only for the application server domain that it is running in. For this reason, orphan rows could be in PSQRYTRANS when no active domain exists. These rows are not seen by the online query monitoring facility, but could potentially exist in the database. Such rows are rare and you can use the database query tool to clean them up. You can use the machine and domain fields to determine whether rows exist that should be cleaned up.