Using the Indexing Metrics Dashboard and Visualizations
Access the Indexing Metrics dashboard by selecting Dashboard, and then selecting Indexing Metrics from the list of dashboards.
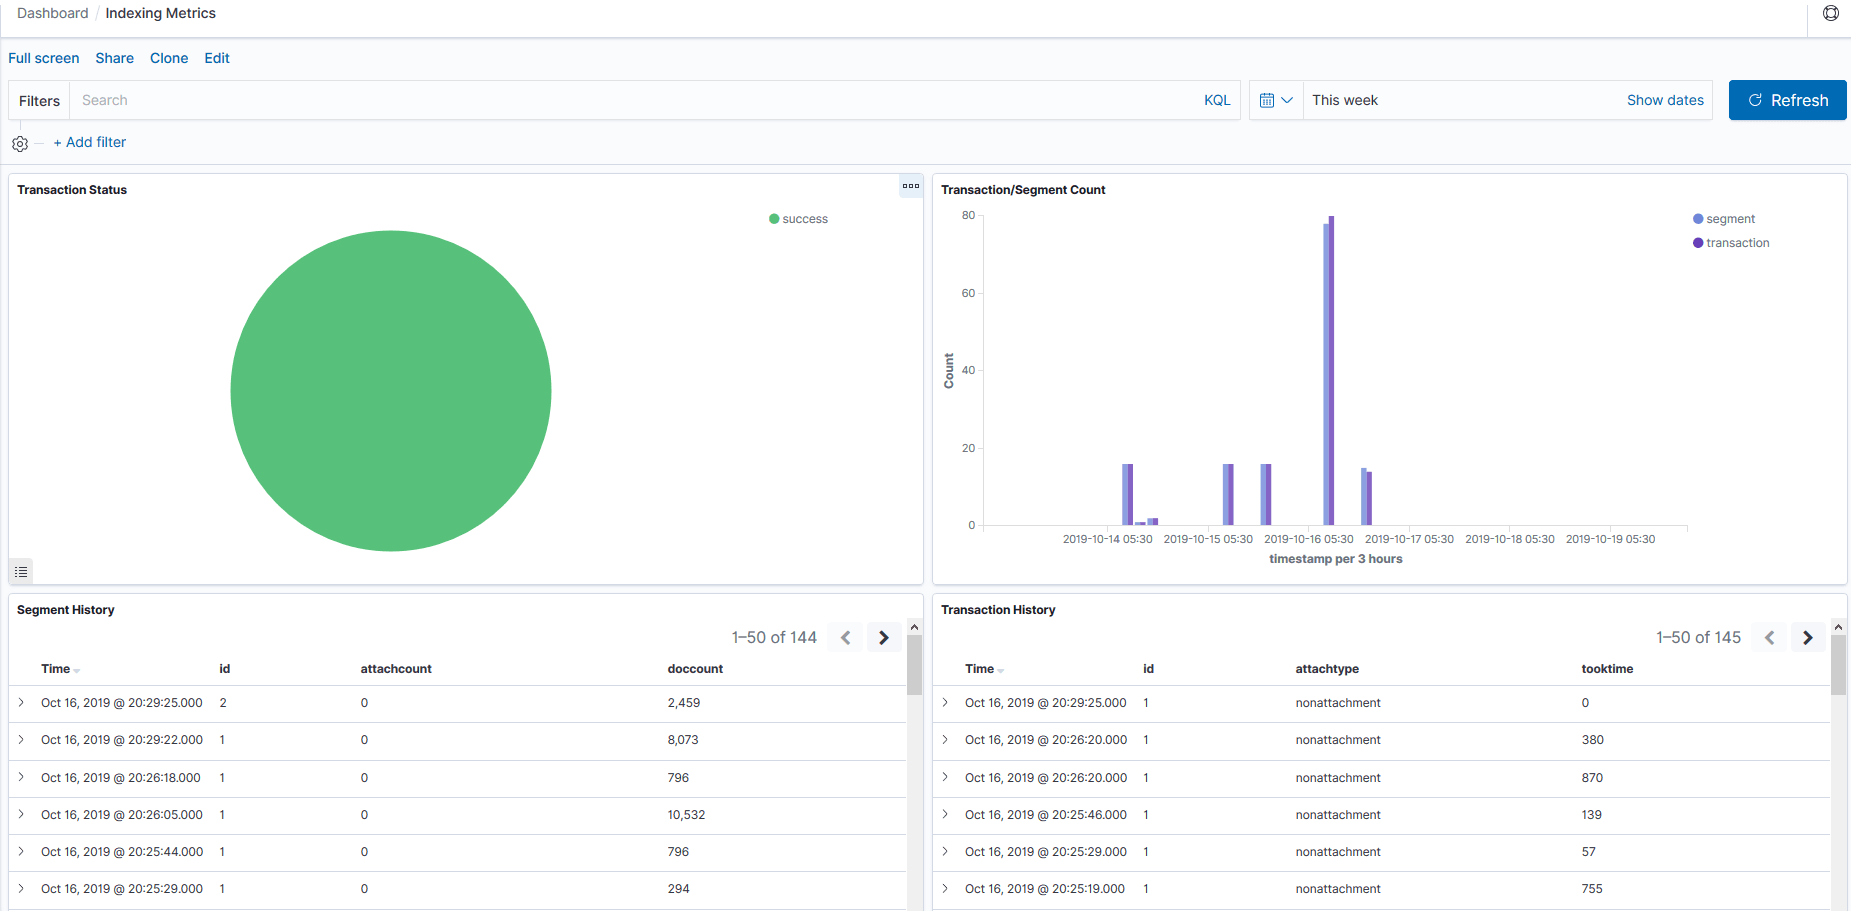
The Indexing Metrics dashboard provides statistics on the transactions and segments during indexing.
This example illustrates the visualizations on the Indexing Metrics dashboard. You can find definitions for the visualizations later on this page.
| Field or Control | Description |
|---|---|
|
Transaction Status |
Displays the status of transactions as a pie-chart. The transaction statuses are:
Selecting any of the slices from the pie-chart enables you to view only the transactions in the selected status in the Transaction Status visualization and the Transaction History visualization displays only the transactions of the selected status, thus enabling you to drill down to each transaction and view details of the transaction, such as process instance, index name, etc. For example, to drill down to the transactions that are in Error status and to understand why the transaction is in Error status, you can perform the following steps:
|
|
Transaction/Segment Count |
Displays the count of transactions and segment at a specific time period in the form of a vertical bar chart. |
|
Segment History |
Displays the segment history and includes the attachment count and document count in each segment. |
|
Transaction History |
Displays the transaction history and includes the attachment type (attachment or non attachment) in each transaction and the time taken for each transaction. |