Using the Indexing Summary Dashboard and Visualizations
Access the Indexing Summary dashboard by selecting Dashboard, and then selecting Indexing Summary from the list of dashboards.
The Indexing Summary provides data on the indexing count and time taken for indexing.
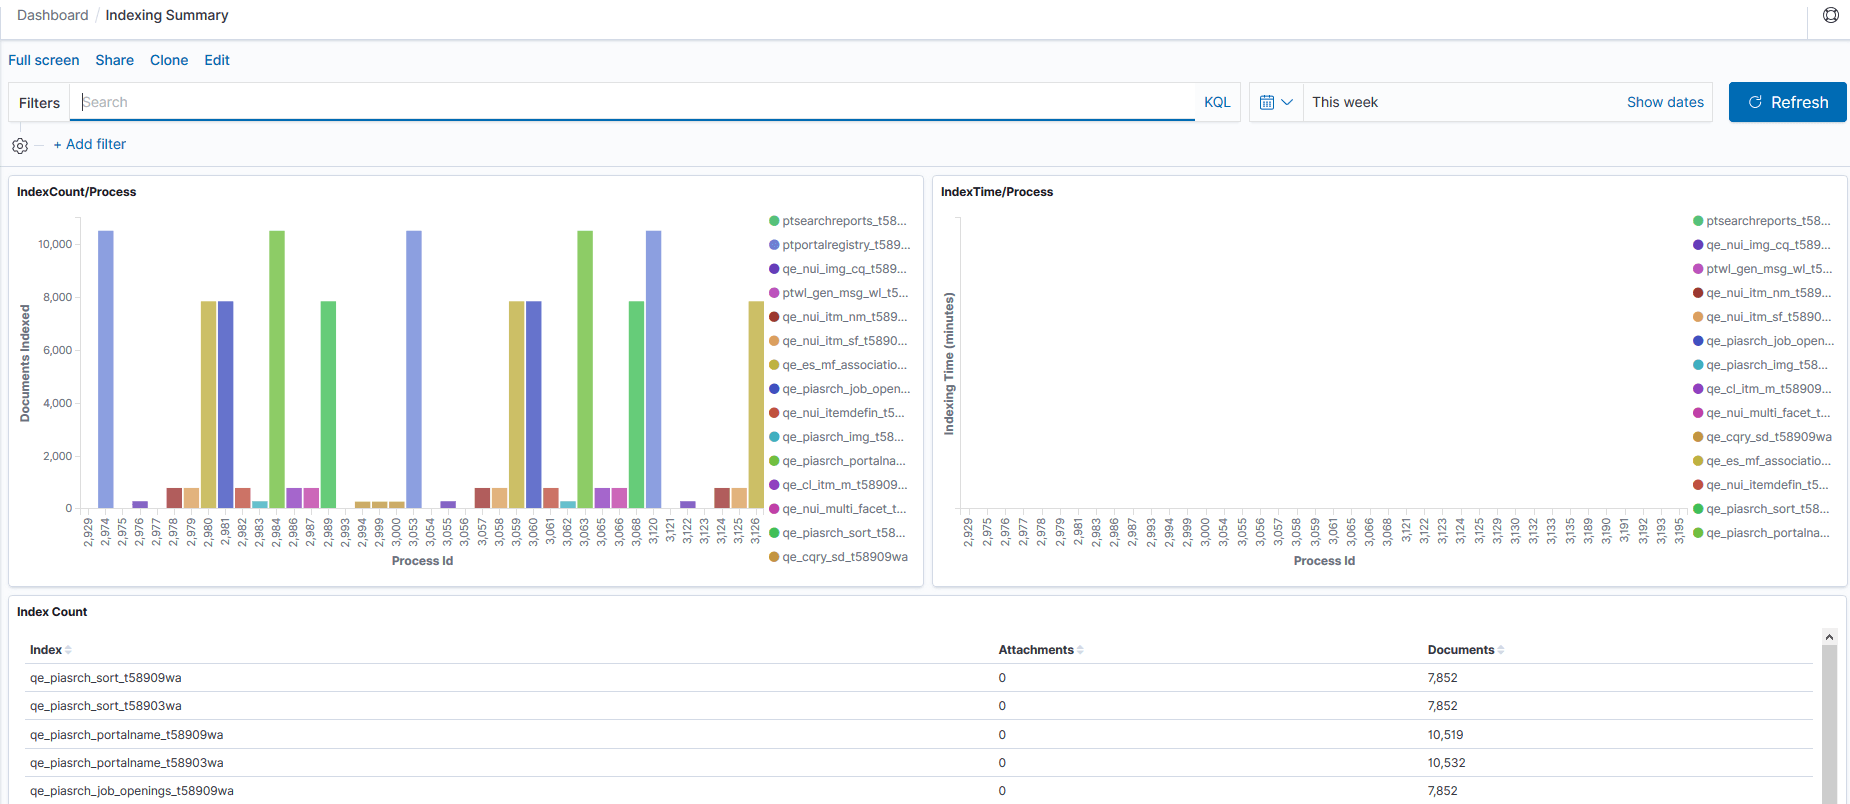
This example illustrates the visualizations on the Indexing Summary dashboard. You can find definitions for these visualizations later on this page.
| Field or Control | Description |
|---|---|
|
IndexCount/Process |
Displays the documents indexed for an index and the process instance ID as a vertical bar chart. If you want to view a particular index, you can use the Search area (at the top of the page) to enter the index name. For example, if you want to obtain information on the ep_ap_payments index, you enter indexname:ep_ap_payments*. |
|
IndexTime/Process |
Displays the time taken for indexing documents for each index and the process instance ID as a vertical bar chart. If the document count is low, but the time taken is considerably high, then you should correlate with the System Metrics dashboard to observe whether the system was unstable. |
|
Index Count |
Displays the count of attachments and documents for each index in a tabular format. |