Using the System Metrics Dashboard and Visualization
Access the System Metrics dashboard by selecting Dashboard, and then selecting System Metrics from the list of dashboards.
The System Metrics dashboard provides an overview of the system health, that is, you can view the real-time health of the system and also view the health of the system over a specific period of time in the past.
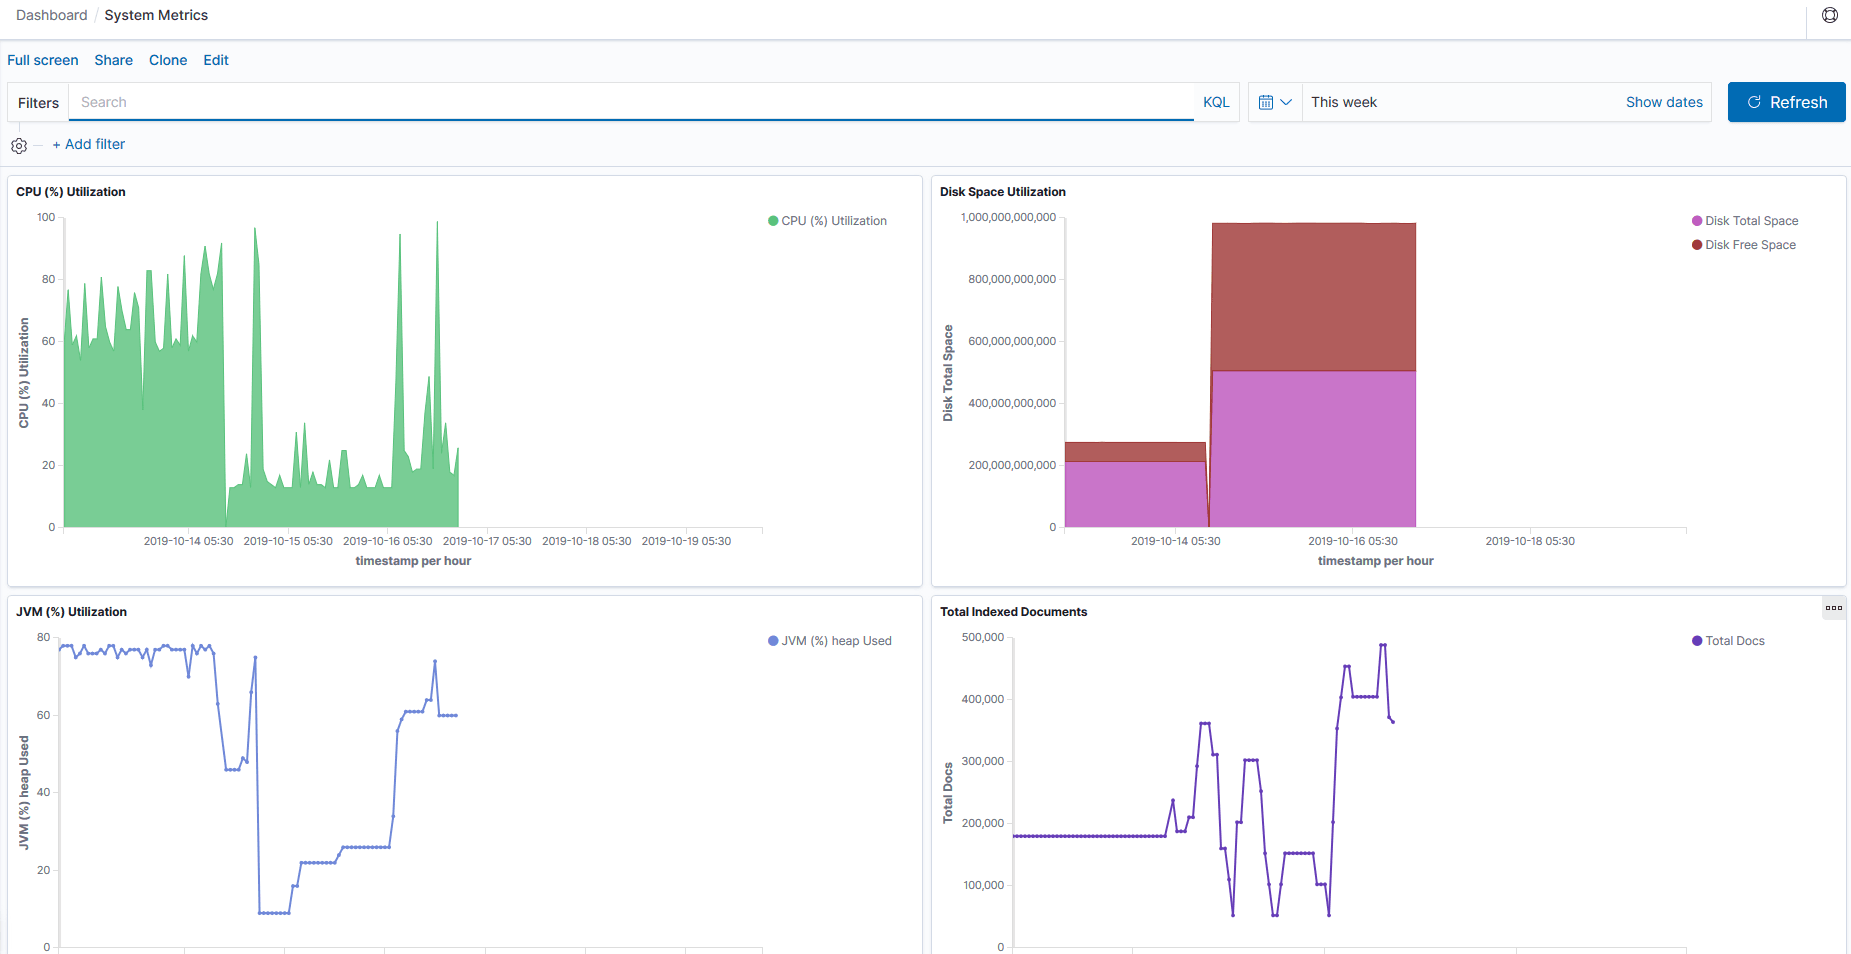
This example illustrates the visualizations on the System Metrics dashboard. You can find definitions for the visualizations later on this page.
| Field or Control | Description |
|---|---|
|
CPU (%) Utilization |
Displays the CPU utilization over a specific period of time by the OpenSearch server in the form of an area chart. |
|
Disk Space Utilization |
Displays the total disk space and the free space available for use in the form of an area chart. The total memory is displayed in bytes. |
|
JVM (%) Utilization |
Displays the total JVM percent used by the OpenSearch server in the form of a vertical bar chart. |
|
Total Indexed Documents |
Displays the total number of indexed documents over a specific period of time in the form of a line chart. |