Understanding Summary Trees
Summary trees are generally used for General Ledger reporting. A summary tree provides an alternative grouping of the nodes from a detail tree without duplicating its entire structure. In a summary tree, the detail values are tree nodes from an existing detail tree rather than values from a database field. The tree groups the nodes from a specific level in the detail tree differently from the way it groups the higher levels in the detail tree itself.
For example, suppose you want to roll up your departmental hierarchy differently for two reports. The first report shows the reporting structure, so you want to group your departments according to the division to which they report. The second report is a financial report, showing profit centers, overhead centers, and production centers. From the group level down, the two hierarchies are the same.
You have two options:
-
Create two complete detail trees that are identical from the group level down.
-
Create one complete detail tree, then create a summary tree whose detail values are the group-level nodes on the first tree.
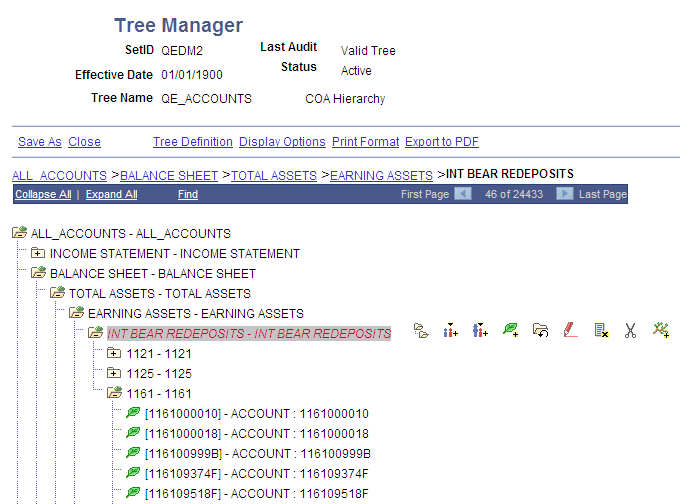
This example illustrates a summary tree.
When you use a node from a summary tree in a report or summary ledger, the system refers back to the detail tree to determine which detail values report to that node. For example, suppose you want to report on production centers. You have created a summary tree that shows which groups are production centers, and you pick the Production Center node. The summary tree shows that the Engineering group and the Manufacturing group (among others) are production centers, but it does not show which departments are in these groups. The system uses the detail tree to determine the departments in the group.
Summary trees make it easier to maintain trees. If you change the lower part of the tree, you need to update only one tree.
The most common use of summary trees is to create summary ledgers in PeopleSoft Financial Data Management applications. You create summary trees based on your basic ChartFields to create alternative roll-ups. You create reports based on the various summary trees to view your financial data from a variety of perspectives.