Test Performance with Apache JMeter
Performance testing is an essential step to ensure that Oracle Analytics Cloud can handle the expected workload without compromising performance. You can use Apache JMeter, an open-source tool for performance testing, to simulate real-world user experience and measure the performance of your Oracle Analytics Cloud reports.
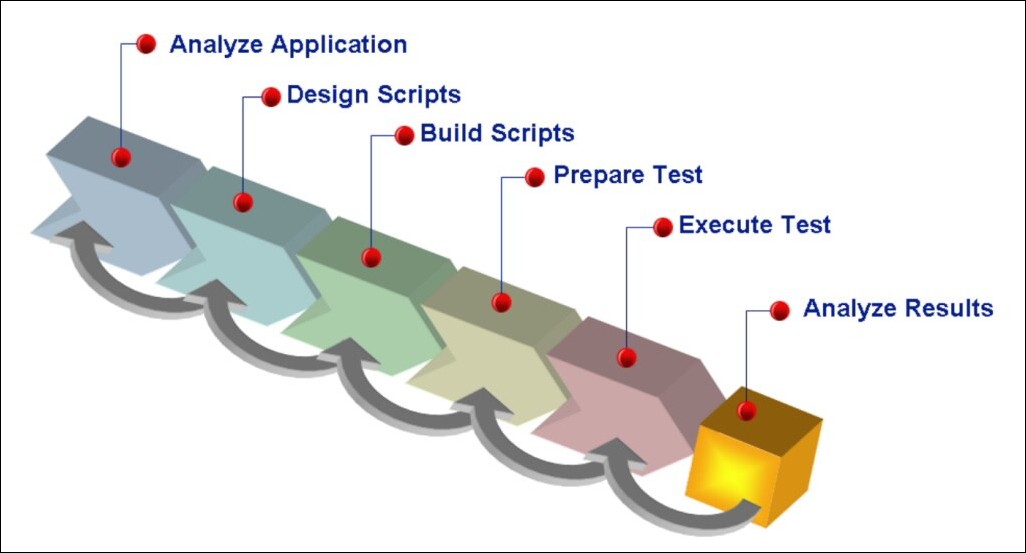
This diagram illustrates the performance testing process for Oracle
Analytics Cloud.
Description of the illustration ceal_test_performance.jpg
-
Determine performance metrics based on realistic scenarios.
To determine performance metrics, you must understand the requirements of Oracle Analytics Cloud and the expectations of your users. For example, if you expect Oracle Analytics Cloud to handle a high volume of users, performance metrics should focus on response time and throughput. Similarly, if you expect Oracle Analytics Cloud to handle a large amount of data, performance metrics should focus on resource utilization. After you've defined the performance metrics are defined, you can set the performance goals.
-
Design a test plan for your metrics.
Your test plan must be designed to simulate real-world scenarios and workload. This means you must identify the number of unique virtual users, the duration of the test, and the think-time between the requests. Set the number of unique virtual users to a realistic value that simulates your actual expected workload. Similarly, set the duration of the test to a realistic value that represents the period of time your users will run reports. Think-time is the time a user takes between two requests, so you must also set a realistic think-time value to simulate your real-world scenario.
You must also include pacing in the script, to ensure that requests are sent at a realistic pace. To achieve accurate and practical results, Oracle recommend that you use different think times for different activities instead of using a fixed think time. For example, a short think time of 20 seconds is recommended for simple dashboard navigation, while a medium think time of 60 seconds for prompt selections. Similarly, when displaying reports, Oracle advise you use a large think time of 120-200 seconds with randomization. This approach ensures that the test accurately reflects real-world user behavior and produces reliable results.
-
Correlate dynamic values.
Correlation involves capturing and replacing dynamic values in the script, such as access tokens, session state IDs, CSRF tokens, and other dynamic parameters. Failure to correlate these values can lead to errors and inaccurate results. Correlation is essential for cloud-based applications like Oracle Analytics Cloud because they use dynamic values to maintain the session and handle user requests. To make this process easier, you can download a sample correlation rules library COR file for Oracle Analytics Cloud , which contains a pre-built set of correlation rules that you can use to create test script for Oracle Analytics Cloud.
-
Record and replay test scripts.
JMeter provides a feature to record user actions and convert them into test scripts. You can use this feature to record user actions in Oracle Analytics Cloud and create test scripts that simulate real-world scenarios. You can replay the recorded scripts multiple times to validate the report's performance. You must design the test scripts to simulate real-world scenarios, such as searching for data, generating reports, and visualizing data.
-
Test with a realistic workload.
To simulate a realistic workload, you must set the number of virtual users to a realistic value that simulates the expected workload. Then, you can gradually increase the workload to identify the maximum capacity of the application. Oracle recommends that you run the test for at least one hour to simulate real-world scenarios and design the workload to simulate peak usage periods, such as the end of the month or the end of the fiscal year.
-
Analyze the results.
When the test is complete, you analyze the results to identify performance bottlenecks, such as slow response times, high error rates, or excessive query capacity utilization. You can do this using metrics available through the Oracle Cloud Infrastructure Monitoring service and JMeter's built-in analysis tools. Once you've identified performance bottlenecks, you can act on your findings to improve the performance of the reports. This can include optimizing queries, improving system settings configurations, or scaling up the number of OCPUs.
If your reports fail to meet your performance goals, you can optimize them by identifying and addressing the bottlenecks. JMeter's listeners can help you identify the slowest requests and you can analyze logs to determine the root cause of performance issues. You might need to optimize your database queries, adjust your cache settings, or scale up your infrastructure to improve Oracle Analytics Cloud performance.
Follow these guidelines to ensure that Oracle Analytics Cloud meets your performance requirements and provides a fast, seamless experience for your organization. With regular performance testing, you can identify and address issues before they impact your users.