Access Metrics for Oracle Analytics Cloud Using the Console (Instance Details)

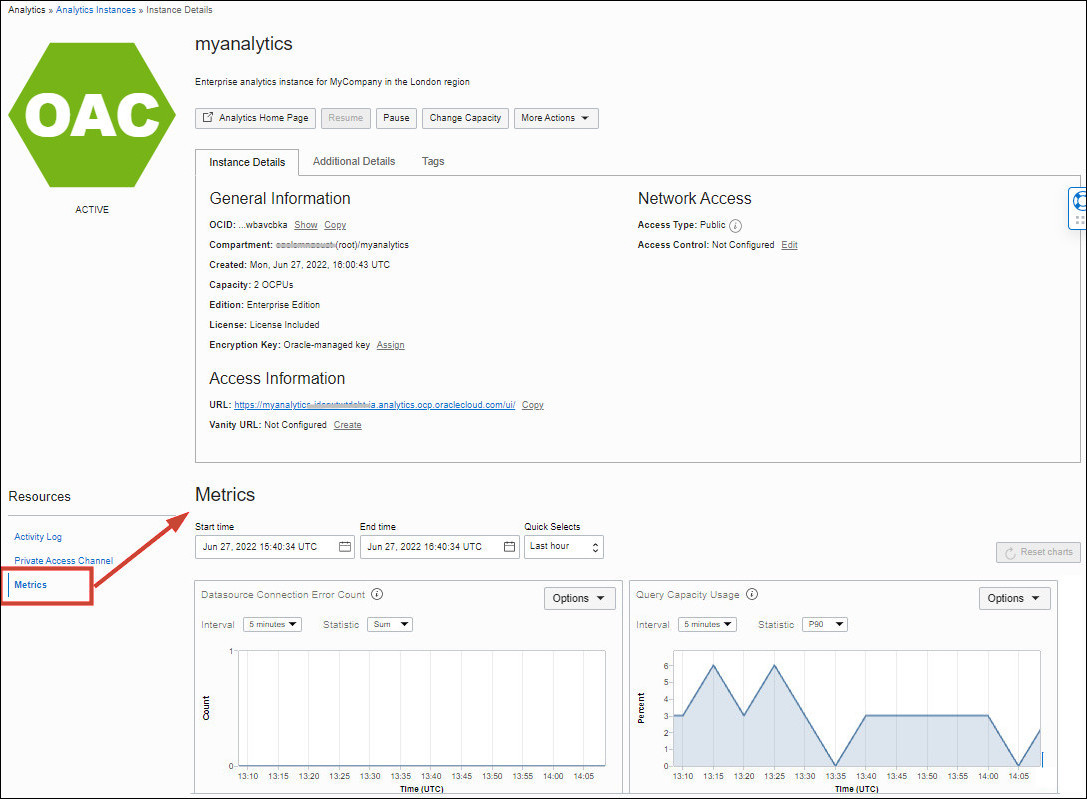
If you're an administrator with manage access, you'll see a Metrics tab on the Oracle Analytics Cloud instance details page. From the Metrics tab, you can view charts that report how many errors occur connecting to your data sources and how much available query capacity you're using.

If you check these metrics regularly, you'll learn to recognize trends as they develop and prevent problems in the future.
  1. In Oracle Cloud Infrastructure Console, click Navigation menu icon in the top left corner.
  2. Click Analytics & AI. Under Analytics, click Analytics Cloud.
  3. Select the compartment that contains the Oracle Analytics Cloud instances you're looking for.
  4. Click the name of the instance you want to view metrics for.
  5. Under Resources, click Metrics.
    Metrics link
  6. Use Quick Selects above the charts to monitor metrics over a different time period.
    Alternatively, change the Start Time and End Time to select a custom range.
  7. Change the Interval and Statistic fields to change the metrics displayed.
    The metric count occurs every five minutes.
  8. Click Options to navigate to the Metrics Explorer where you can create custom metric dashboards and alarms. For general information about monitoring in Oracle Cloud Infrastructure, see Monitoring.