Access Metrics for Oracle Analytics Cloud Using the Console (Metrics Explorer)

You can use the Metrics Explorer in Oracle Cloud Infrastructure Console to monitor metrics for Oracle Analytics Cloud, and other resource types such as Oracle Cloud Database, virtual cloud network, and so on.

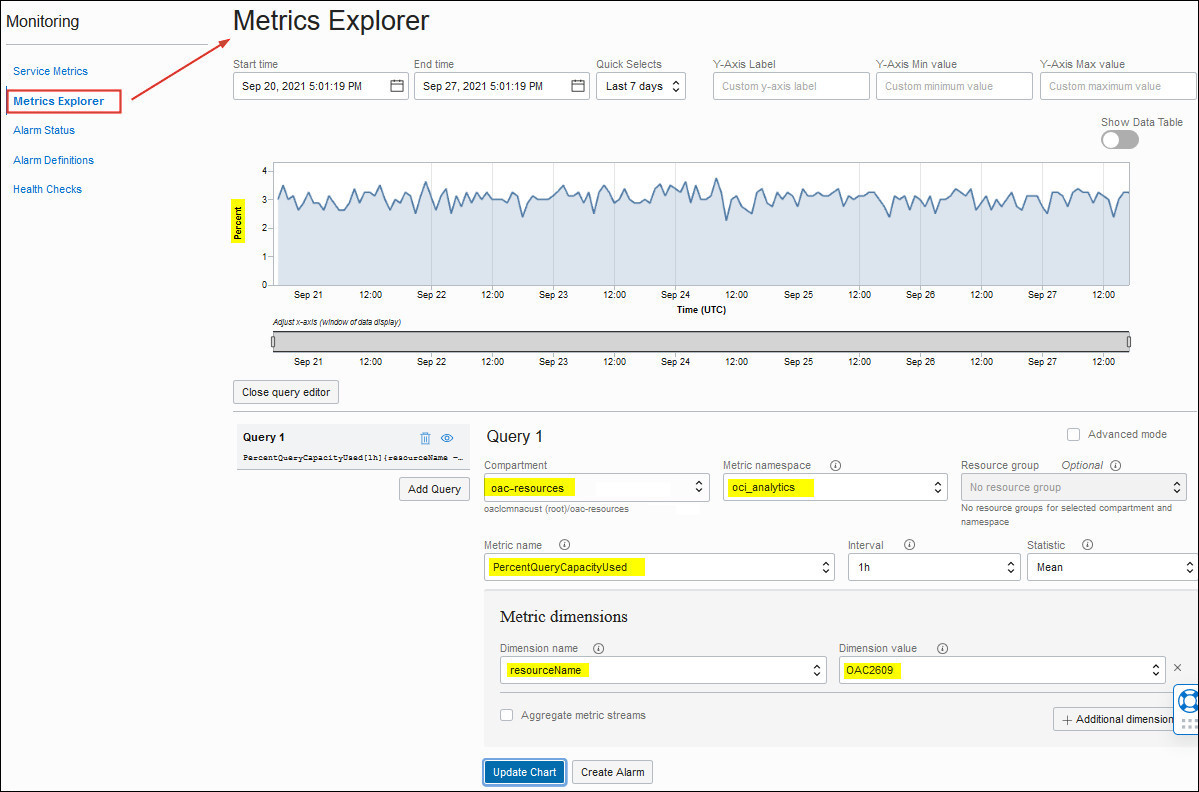
For Oracle Analytics Cloud, you can view charts that report how many errors occur connecting to your data sources and how much available query capacity you're using. If you check these metrics regularly, you'll learn to recognize trends as they develop and prevent problems in the future.

  1. In Oracle Cloud Infrastructure Console, click Navigation menu icon in the top left corner.
  2. Click Observability & Management. Under Monitoring, click Metrics Explorer.
  3. In Compartment, select the compartment that contains the Oracle Analytics Cloud instance you're looking for.
  4. In Metrics namespace, select oci_analytics.
  5. In Metric name, select the metric you want to monitor.
    • Query Capacity Usage (%) (PercentQueryCapacityUsed)
    • Data Source Connection Errors (DataSourceConnectionErrors)

    If required, edit the Interval and Statistic fields to change the aggregation window and aggregation function.

  6. In Dimension name and Dimension value, select resourceName and then select the name of the instance you want to view metrics for.
  7. Click Update Chart.
    Metrics Explorer
  8. Optionally, change the Start time and End time to view the metrics over a specific time range.

For general information about monitoring in Oracle Cloud Infrastructure, see Monitoring.