Integrate Oracle Analytics Cloud with Microsoft Power BI (Preview)
Follow these tips to integrate Oracle Analytics Cloud with Microsoft Power BI.
Integrate Oracle Analytics Cloud with Microsoft Power BI to leverage the visualization and publishing capabilities offered by Microsoft Power BI Desktop combined with the enterprise modelling capabilities of Oracle Analytics to create powerful insights into your data.
- In Power BI Desktop, create visualizations and save the project in a Power BI Desktop document (PBIX).
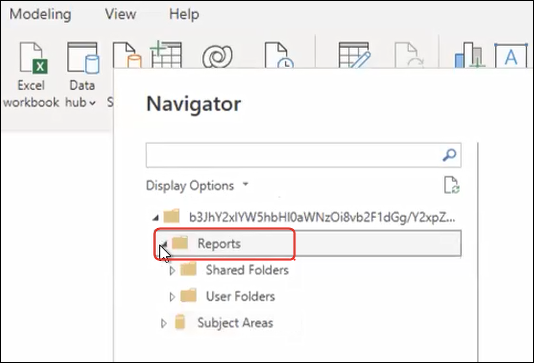
- (Recommended approach for to consume reports) Use the Navigator to add reports directly – Analysts can use the Navigator to select reports (analyses) from Oracle
Analytics Cloud to add them to a Power BI visualization. In the connect dialog, enter the Power BI App Key in the Instance URL field and leave the Logical Query box empty. You can then use the Navigator to browse to the Reports area.
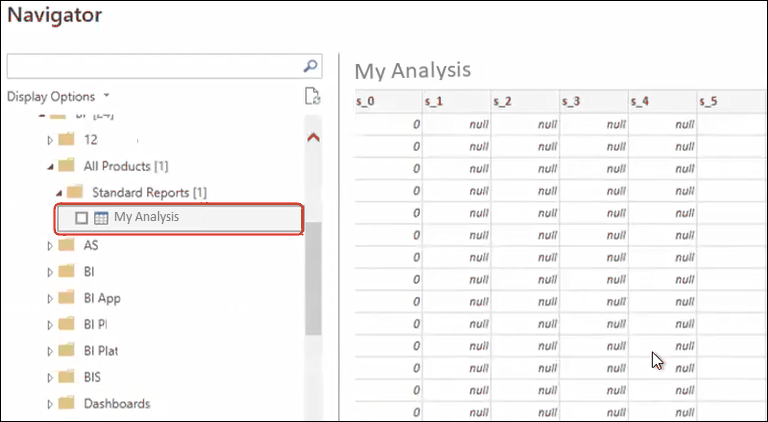
In the Reports area, select a report to add to your Power BI project. In the Reports areas, you can browse for available analyses to add to your Power BI project.
This method takes advantage of the Oracle Analytics Cloud data model.
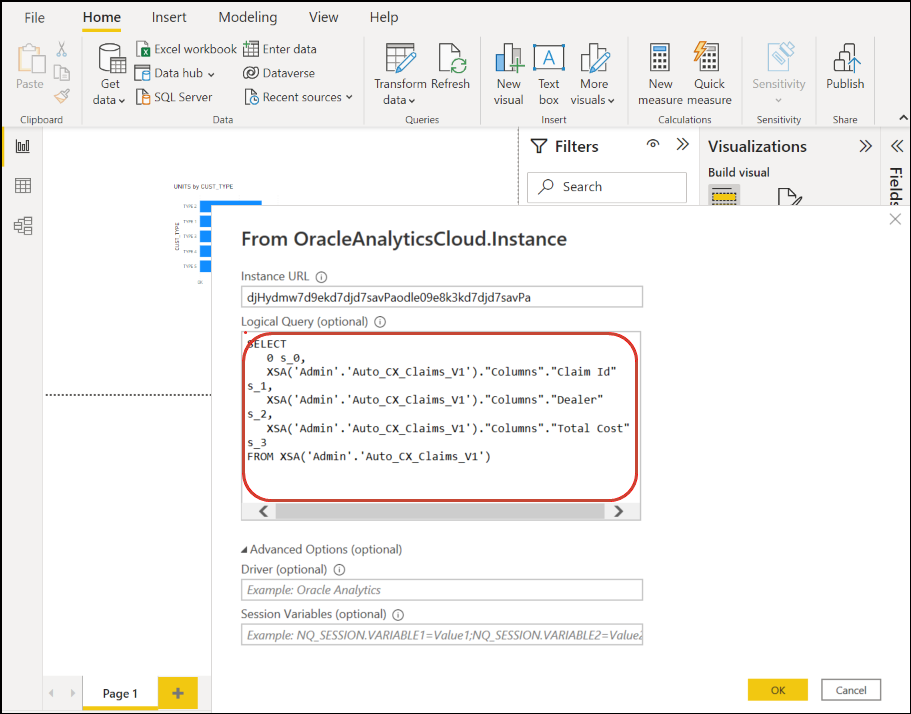
Alternatively, you can copy the Logical SQL code from the Advanced Tab of an analysis.
- (Recommended approach to consume workbooks) Copy SQL code from Oracle Analytics In a workbook, copy the SQL code from the Developer panel to add them to a Power BI visualization. Then, in the connect dialog enter the Power BI App Key in the Instance URL field and copy the SQL code into the Logical Query box. This method takes advantage of the Oracle
Analytics Cloud data model.
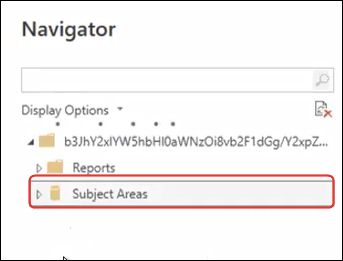
- Browse subject areas manually - Analysts can select subject area tables to load by browsing the subject areas manually. In the connect dialog, enter the Power BI App Key in the Instance URL field and leave the Logical Query box empty. You can then use the Navigator to manually select tables in the Subject Areas folder.
In Oracle Analytics Cloud, curate subject areas specifically to meet the reporting needs of the Power BI users. Make sure that subject areas are curated with both fact and dimension columns in a single subject area table.
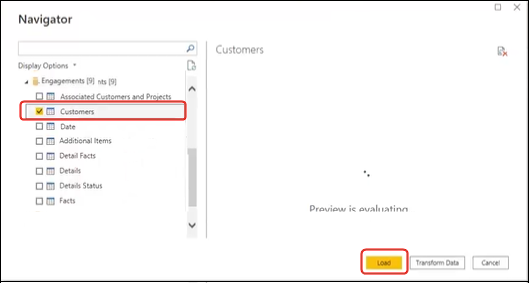
Description of the illustration power-bi-4.pngYou can use this approach for basic data, however be aware that Microsoft Power BI makes assumptions and optimizations that affect your analysis results. As a result, it might be more difficult to debug and audit the queries that Microsoft Power BI generates.
In addition, when you access tables by browsing the subject areas, each table is loaded independently of other tables. Subject areas are often structured into dimension and fact tables that don't include related columns.
- (Recommended approach for to consume reports) Use the Navigator to add reports directly – Analysts can use the Navigator to select reports (analyses) from Oracle
Analytics Cloud to add them to a Power BI visualization. In the connect dialog, enter the Power BI App Key in the Instance URL field and leave the Logical Query box empty. You can then use the Navigator to browse to the Reports area.
- Share the Power BI (PBIX) project with other users, who can manipulate any of the visualizations in the project.
