Add and Delete Pages in Dashboards
Build your dashboards and configure content.
Topics:
Add Pages to Dashboards
You can add new pages to organize content of a dashboard.
For example, you can first add a new dashboard page that contains regional sales data in a table and in a bar graph. Then, you can add another that contains links to various competitors' web sites.
- Open the dashboard for editing.
- On the toolbar of the Dashboard builder, click Add Dashboard Page and select the Add Dashboard Page menu option.
- Follow the on-screen instructions.
Print Dashboards
You typically view dashboards in electronic form. You can easily print a dashboard if you want to see its pages in PDF or HTML format.
For example, you can print a Stock Control dashboard page so you can refer to it during a visit to a supplier's factory. At this location, no external computing devices are permitted.
-
Open the dashboard.
-
Navigate to the dashboard page to print.
-
Click Page Options, then select Print.
-
Select Printable PDF or Printable HTML.
-
Open Adobe Acrobat or a browser window and print from there.
Add Subpages to Dashboards
You can add a new subpage to a dashboard to display additional information.
Adding subpages allows a second level of information to be presented to users. For example, you can first add a new dashboard page that contains regional sales data in a table and in a bar graph. Then, you can add a subpage that contains links to various competitors' web sites.
- Open the dashboard for editing.
- On the toolbar of the Dashboard builder, click Add Dashboard Page and select the Add Subpage menu option.
- Follow the on-screen instructions.
Add Content to Dashboard Pages
You can add dashboard objects (any of the objects from the Dashboard objects pane) to dashboard pages. You can also add objects that you have saved in the catalog.
For example, you can add content to the newly created Sales Performance dashboard to track your team's progress. To do so, you can add a Brand Revenue analysis from the catalog.
- Open the dashboard for editing.
- Navigate to the page to which you want to add content.
- In the Dashboard Builder, select the objects to analyze in the Dashboard Objects pane or the Catalog pane and drag and drop them to the Page Layout area.
- Use Column to add a column to align content on a dashboard. You can create as many columns on a dashboard page as you need. You can place columns horizontally or vertically.
- Use Section to add sections within columns to hold the content for the page, such as action links and analyses. You can include as many sections as you need for a column.
- Use Link or Image to add links to content to your dashboard. Drag Link or image to the dashboard design, then click Properties to configure it.
Use the Destination options to specify the URL to a workbook, dashboard, or analysis.
To add an image or graphic for the link, use the Image options to select, upload, and position images. Use the Description field to provide alternative text (known as Alt Text) to be used by screen readers to make the image accessible.
- Use Publisher Report to add one or more reports to make them available to other users. You can use a report to add configured analyses to a dashboard page. You can add a report as embedded content for display on the dashboard page or as a link to open the report in Oracle Analytics Publisher. If you modify in Oracle Analytics Publisher a report you added to a dashboard page and save your changes, then you must refresh the dashboard page to see those modifications.
- Use Visualizations to embed visualizations and canvases in dashboards to
share them with analysts. Drag the project onto the canvas, then choose
which canvas or insight to display.
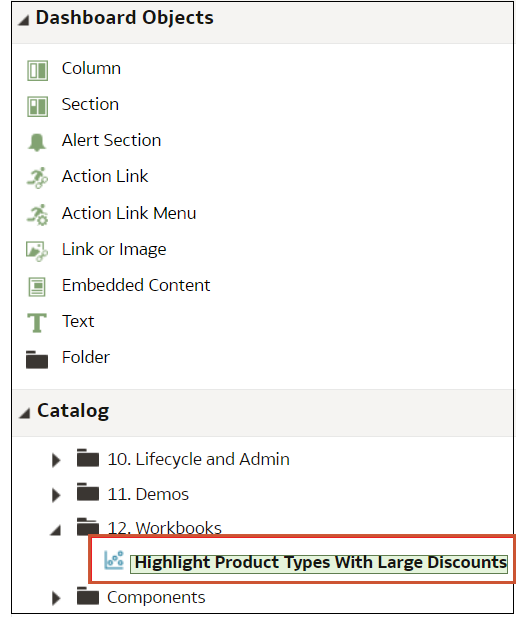
Description of the illustration dv_in_catalog.png
- Set the properties of each object, as appropriate by clicking Properties.
- Click Save.
Understand How Dashboard Pages and Oracle Analytics Publisher Reports Interact
You can run, view, and interact with a Publisher report on a dashboard page.
When you add a Publisher report to a dashboard page, the report includes a toolbar that provides these options:
- Analyze the data in the report.
- Select the layout template of the report.
- Change the output format of the report.
- Export the report.
- Send the report to an available destination such as a printer, fax, email, or FTP.
- Schedule the report.
When you configure an agent for a dashboard page that contains a Publisher report, be aware of these criteria:
- The output format of the Publisher report must be PDF.
- The agent must be set to deliver content in PDF format.
You can print a dashboard page or a briefing book that contains a Publisher report in certain formats.
If you want to print a dashboard page that contains a Publisher report or to include the page in a briefing book, then you must keep the following points in mind:
- If you print the briefing book as PDF and if the output format of the Publisher report is PDF, then the Publisher report is printed after the other objects on the page. If you print a dashboard page that contains a Publisher report as PDF, but the dashboard page isn’t part of a briefing book, then the Publisher report isn’t printed.
- If you print the dashboard page or briefing book as MHTML, then the Publisher report isn’t printed.
Configure the Style and Behavior of Dashboards and Pages
Use dashboard properties to configure style and behavior of dashboards and pages. For example, you might specify whether your team members can export, refresh, or print pages in a dashboard.
Change the Properties of Objects Added to Dashboard Pages
You can change the properties of objects that have been added to a dashboard page.
For example, you can change the column properties of the Brand Revenue analysis to specify the heading display in 14-point bold Helvetica font.
Make Dashboard Sections Collapsible In Accessibility Mode
Use dashboard properties to enable dashboard users to collapse and expand sections of a dashboard.
- Open the dashboard for editing.
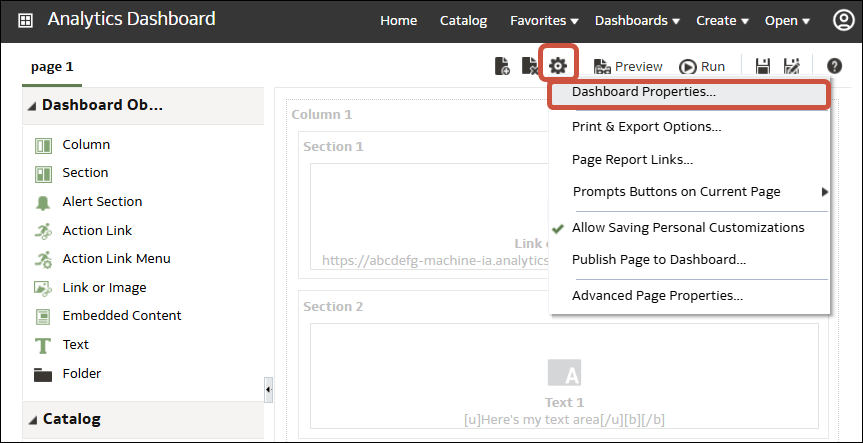
- Click Tools and select Dashboard Properties.
- Select Section Collapsible in Accessibility Mode.
- Click OK, then click Save.
Delete Objects on Dashboard Pages
If you add an object that you later decide that you don’t want, then you can delete it.
For example, you can delete last year's Brand Revenue analysis from the Sales Performance dashboard, to replace it with the current year's analysis.
- Open the dashboard for editing.
- Navigate to the page that contains the object to delete.
- Hover the mouse pointer over the object in the Page Layout area to display the object's toolbar and click Delete.
Delete Dashboard Pages
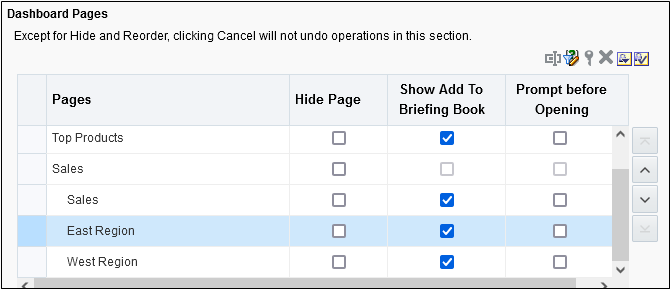
You can delete the current dashboard page, or one or more dashboard pages.
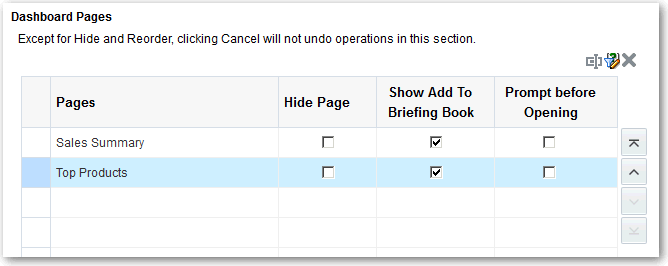
For example, you can delete pages 2 and 3 from the Sales Performance dashboard to retain only the page with the most recent Brand Revenue analysis.
You can delete one or more dashboard pages:
- Open the dashboard for editing.
- Click Tools and select Dashboard Properties.
- For each page to delete:
- Click OK.
