Assign a Map Layer to a Data Column
Assign a map layer to a data column to use it consistently in any workbook.
You can assign a map layer to a column that contains text or numeric attributes, for example, columns such as Airport Name, Latitude, and Longitude. When you select a data column with a map layer assignment for a visualization, Oracle Analytics automatically creates a map visualization.
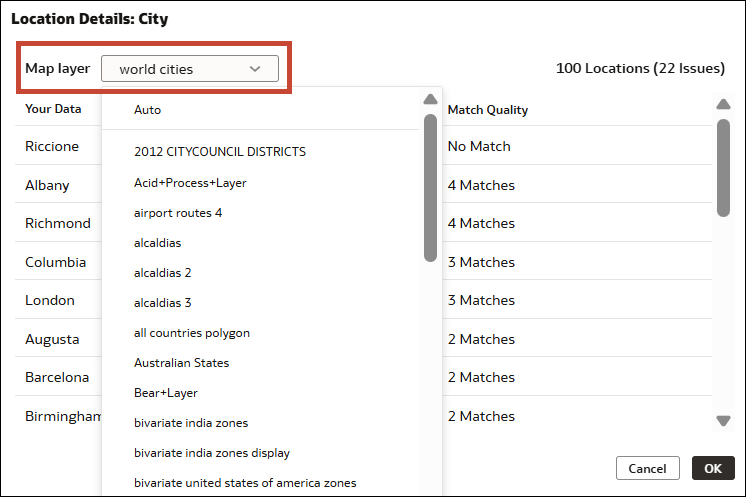
- In Location Details, review the associated map layer and select a different one if required, then click OK.The property change is listed as a Change Property step in the Preparation Script pane.
- In the Properties pane for the updated column, click Location
 to verify the map layer associated with the column. In the workbook editor, in the Data pane, the column is now identified with the same location icon and is treated as a location rather than a numeric or text attribute.