Change the Visualization Color Palette
You can switch between the various color palettes until you find the one you want.
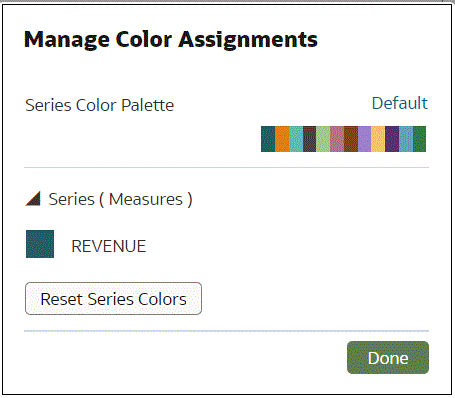
Each color palette contains 12 colors that you can apply to a visualization.
- On your home page, hover over a workbook, click Actions, then select Open.
- Click Edit to open the workbook in author mode.
- Select a visualization to change the color palette.
- Click Menu, select Color, and then select Manage Assignments.
- In Manage Color Assignments, click the color palette.
- From the Series Color list, click a color palette and click Done.
