Configure the Properties for a Gantt Chart
Customize a Gantt visualization by updating the properties.
You can modify the level of granularity used for the two time scales on the horizontal axis. You can also configure the position of the horizontal axis, the gridlines for the visualization, and add data labels to the bars.
- On your home page, hover over a workbook, click Actions, then select Open.
- Click the Gantt visualization to select it.
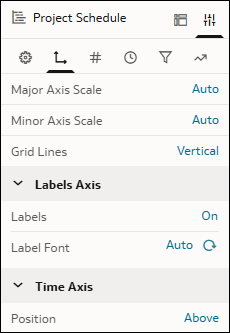
- In the Grammar pane, click Properties, then click Axis.
- In the Major Axis Scale and Minor Axis Scale rows, click Auto and choose an appropriate unit of time.
- In the Grid Lines row, click Vertical and choose a configuration.
- In the Position row under Time Axis, click Above to change it to Below and move the axis to the top of the visualization.
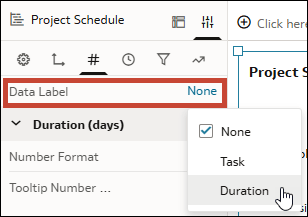
- Click Values.
- In the Data Labels row, click None and select the column you want to use to add labels to the bars.
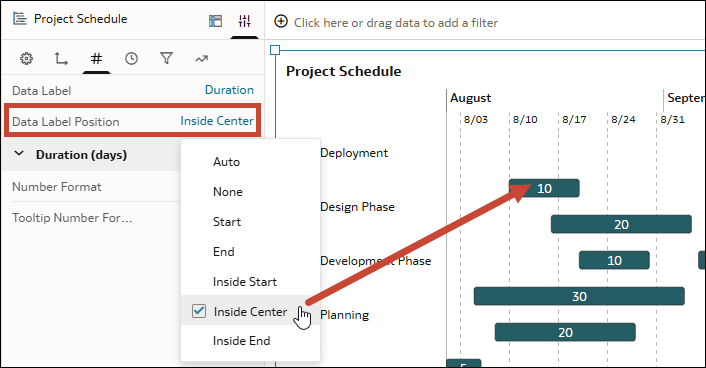
- In the Data Label Position row, click None and select where you want the label to appear in relation to the bars.
- Click Save.


