Add Additional Columns to the Rows in a Gantt Chart
Display multiple items in each row of a Gantt chart. For example, you can display tasks and their subtasks.
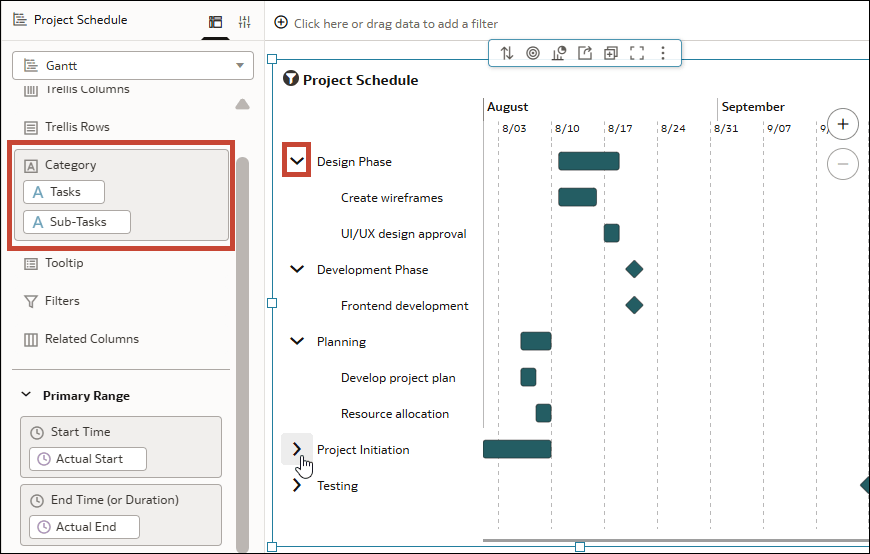
To show multiple items per row in a Gantt chart you add multiple, hierarchically-related columns to Category in the Grammar pane. The order they appear under Category dictates how they appear in the visualization. You can expand each row item in the vertical axis of the visualization to see the bars for the secondary items.
For example, you might use columns called Tasks and Sub-Tasks in Category. Both Tasks and Sub-Tasks have corresponding Actual Start and Actual End columns. In the visualization, you can expand each task, like Design Phase, in the vertical axis to see the bars for the related subtasks, like Create wireframes and UI/UX design approval.
Description of the illustration gantt_chart_hierarchical_data_row_display.png
- On your home page, hover over a workbook, click Actions, then select Open.
- Click the Gantt visualization to select it.
- In the Data pane, click Data and drag the related attribute column to Category in the Grammar pane below the existing attribute column.
- In the vertical axis, expand the top-level categories and display the subcategories.
- Click Save.